
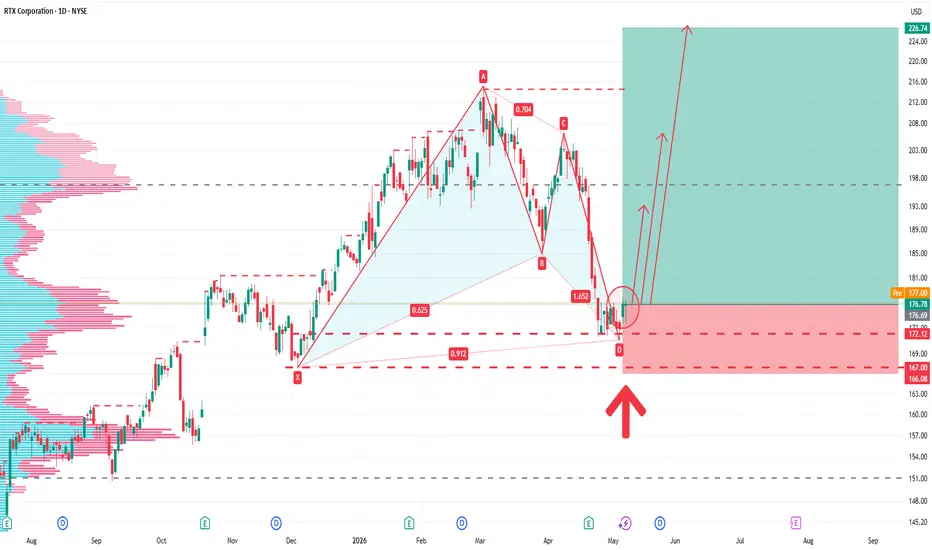
RTX Daily Long Trading Plan
Stock Symbol: RTX (Raytheon Technologies)
Timeframe: Daily
Trading Direction: Long
Entry Price: Around $176.78
Stop Loss: $166.00
TP1: Around $195.00
Close 50% position, move stop loss to breakeven.
TP2: Around $208.00
Close half of remaining position, trail stop loss to lock profits.
TP3: Around $225.00
Reduce half of leftover position, continue trailing stop protection.
Remaining Position: Hold with trailing stop loss and follow market trend to exit.
Risk Warning
U.S. stock market is affected by geopolitics, Federal Reserve monetary policy, corporate earnings and macroeconomic data, with large price volatility. There exists risk of principal loss. Strictly abide by stop-loss discipline, do not arbitrarily adjust stop-loss levels or over-positioning. This plan is only technical reference, not investment advice. All transactions shall be based on personal risk tolerance.
Stock Symbol: RTX (Raytheon Technologies)
Timeframe: Daily
Trading Direction: Long
Entry Price: Around $176.78
Stop Loss: $166.00
TP1: Around $195.00
Close 50% position, move stop loss to breakeven.
TP2: Around $208.00
Close half of remaining position, trail stop loss to lock profits.
TP3: Around $225.00
Reduce half of leftover position, continue trailing stop protection.
Remaining Position: Hold with trailing stop loss and follow market trend to exit.
Risk Warning
U.S. stock market is affected by geopolitics, Federal Reserve monetary policy, corporate earnings and macroeconomic data, with large price volatility. There exists risk of principal loss. Strictly abide by stop-loss discipline, do not arbitrarily adjust stop-loss levels or over-positioning. This plan is only technical reference, not investment advice. All transactions shall be based on personal risk tolerance.
액티브 트레이드

면책사항
해당 정보와 게시물은 금융, 투자, 트레이딩 또는 기타 유형의 조언이나 권장 사항으로 간주되지 않으며, 트레이딩뷰에서 제공하거나 보증하는 것이 아닙니다. 자세한 내용은 이용 약관을 참조하세요.
면책사항
해당 정보와 게시물은 금융, 투자, 트레이딩 또는 기타 유형의 조언이나 권장 사항으로 간주되지 않으며, 트레이딩뷰에서 제공하거나 보증하는 것이 아닙니다. 자세한 내용은 이용 약관을 참조하세요.