
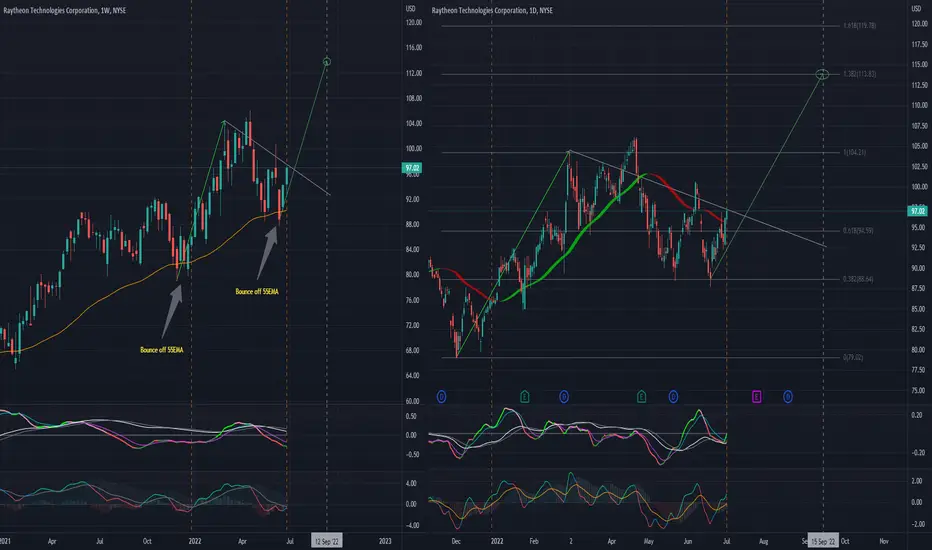
A repeated patter on the weekly RTX chart appears to be forming, and technical indicators are set up similarly.
The daily chart is also in alignment as previously. Technical Indicators have just crossed over and suggest a breakout is in order.
About 15% upside potential with upside target at 113.80, about mid-September 2022.
Fundamental and geopolitical alignment should start appearing soon...
Watch this one!
The daily chart is also in alignment as previously. Technical Indicators have just crossed over and suggest a breakout is in order.
About 15% upside potential with upside target at 113.80, about mid-September 2022.
Fundamental and geopolitical alignment should start appearing soon...
Watch this one!

면책사항
해당 정보와 게시물은 금융, 투자, 트레이딩 또는 기타 유형의 조언이나 권장 사항으로 간주되지 않으며, 트레이딩뷰에서 제공하거나 보증하는 것이 아닙니다. 자세한 내용은 이용 약관을 참조하세요.
면책사항
해당 정보와 게시물은 금융, 투자, 트레이딩 또는 기타 유형의 조언이나 권장 사항으로 간주되지 않으며, 트레이딩뷰에서 제공하거나 보증하는 것이 아닙니다. 자세한 내용은 이용 약관을 참조하세요.