
This is a continuation of the previous chart analysis. It’s a long journey—almost like a field trip.
The Russell 2000 Index is currently at a year-to-date level of +6.53%.
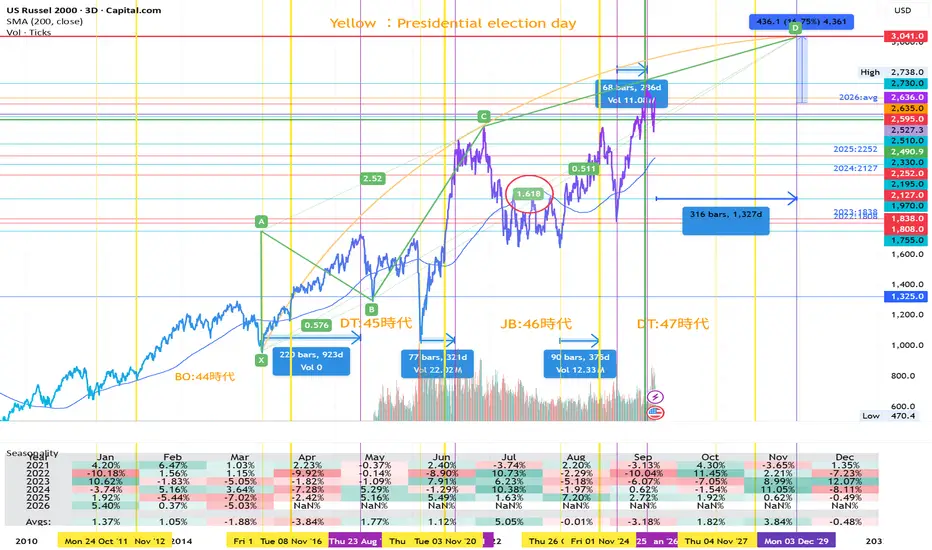
Now then, according to geometric delta analysis, with a remaining time of approximately 1,327 days, the level along the trajectory defined by the golden ratio (1.618) is 3,041 points.
This reflects the typical relationship between U.S. presidential election timing and equity market behavior. Given that the Russell 2000 consists of small- and mid-cap stocks, it tends to enter an upward trend roughly one year prior to a U.S. presidential election.
Yellow :Presidential election day
The Russell 2000 Index is currently at a year-to-date level of +6.53%.
Now then, according to geometric delta analysis, with a remaining time of approximately 1,327 days, the level along the trajectory defined by the golden ratio (1.618) is 3,041 points.
This reflects the typical relationship between U.S. presidential election timing and equity market behavior. Given that the Russell 2000 consists of small- and mid-cap stocks, it tends to enter an upward trend roughly one year prior to a U.S. presidential election.
Yellow :Presidential election day

관련 발행물
면책사항
해당 정보와 게시물은 금융, 투자, 트레이딩 또는 기타 유형의 조언이나 권장 사항으로 간주되지 않으며, 트레이딩뷰에서 제공하거나 보증하는 것이 아닙니다. 자세한 내용은 이용 약관을 참조하세요.
면책사항
해당 정보와 게시물은 금융, 투자, 트레이딩 또는 기타 유형의 조언이나 권장 사항으로 간주되지 않으며, 트레이딩뷰에서 제공하거나 보증하는 것이 아닙니다. 자세한 내용은 이용 약관을 참조하세요.