
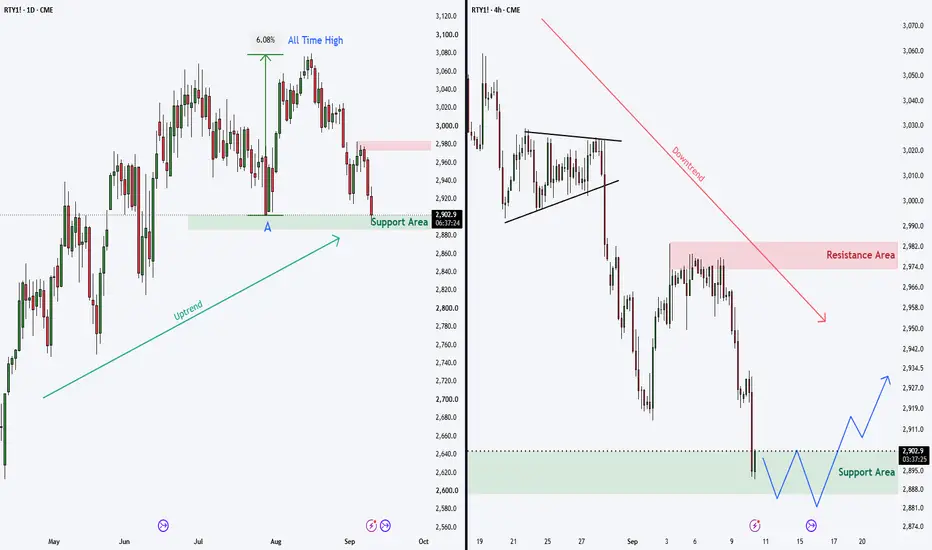
RTY1! Multiple Timeframe Analysis:
On the Daily chart (LEFT), we can see that this price zone (A) previously acted as support and led to a strong +6% move to a new all-time high. The Daily chart is still in an uptrend.
However, the 4H chart (RIGHT) is trending steadily lower, and at the moment there is no clear sign that the downtrend is coming to an end.
Since the Daily trend (LEFT) remains intact, we could potentially see a bullish reversal if a double bottom, a breakdown failure, or a strong bullish candle forms on the 4H chart (RIGHT). Such a setup could lead to an upward move toward the $2,980 resistance area, or potentially even higher.

면책사항
해당 정보와 게시물은 금융, 투자, 트레이딩 또는 기타 유형의 조언이나 권장 사항으로 간주되지 않으며, 트레이딩뷰에서 제공하거나 보증하는 것이 아닙니다. 자세한 내용은 이용 약관을 참조하세요.
면책사항
해당 정보와 게시물은 금융, 투자, 트레이딩 또는 기타 유형의 조언이나 권장 사항으로 간주되지 않으며, 트레이딩뷰에서 제공하거나 보증하는 것이 아닙니다. 자세한 내용은 이용 약관을 참조하세요.