
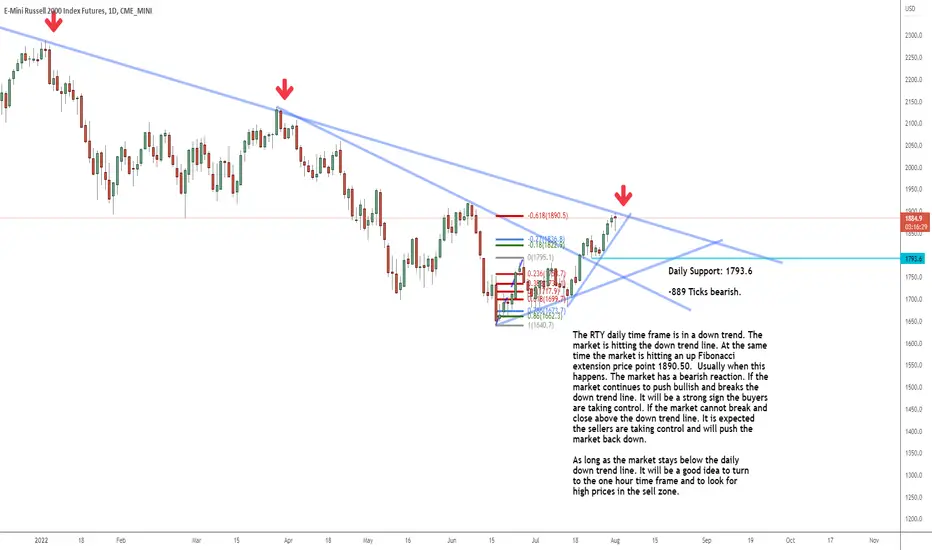
The RTY daily time frame is in a down trend. The
market is hitting the down trend line. At the same
time the market is hitting an up Fibonacci
extension price point 1890.50. Usually when this
happens. The market has a bearish reaction. If the
market continues to push bullish and breaks the
down trend line. It will be a strong sign the buyers
are taking control. If the market cannot break and
close above the down trend line. It is expected
the sellers are taking control and will push the
market back down.
As long as the market stays below the daily
down trend line. It will be a good idea to turn
to the one hour time frame and to look for
high prices in the sell zone.
market is hitting the down trend line. At the same
time the market is hitting an up Fibonacci
extension price point 1890.50. Usually when this
happens. The market has a bearish reaction. If the
market continues to push bullish and breaks the
down trend line. It will be a strong sign the buyers
are taking control. If the market cannot break and
close above the down trend line. It is expected
the sellers are taking control and will push the
market back down.
As long as the market stays below the daily
down trend line. It will be a good idea to turn
to the one hour time frame and to look for
high prices in the sell zone.

관련 발행물
면책사항
해당 정보와 게시물은 금융, 투자, 트레이딩 또는 기타 유형의 조언이나 권장 사항으로 간주되지 않으며, 트레이딩뷰에서 제공하거나 보증하는 것이 아닙니다. 자세한 내용은 이용 약관을 참조하세요.
면책사항
해당 정보와 게시물은 금융, 투자, 트레이딩 또는 기타 유형의 조언이나 권장 사항으로 간주되지 않으며, 트레이딩뷰에서 제공하거나 보증하는 것이 아닙니다. 자세한 내용은 이용 약관을 참조하세요.