
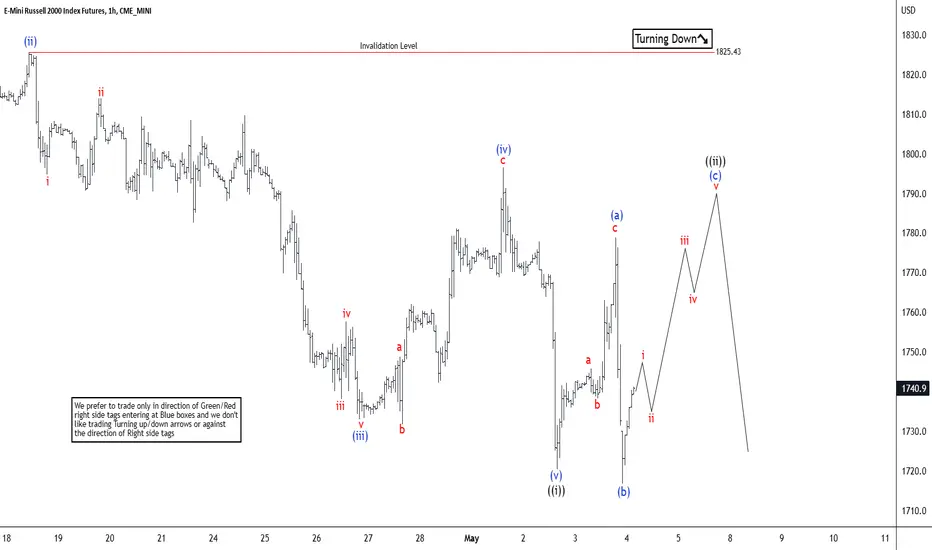
Russell 2000 (RTY) Cycle from 4.3.2023 high is in progress as a 5 waves diagonal. Down from 4.3.2023 high, wave (i) ended at 1752.7 and rally in wave (ii) ended at 1825.43. The 1 hour chart below shows the chart starting from wave (ii) peak. The Index then resumes lower in wave (iii) towards 1731.7. Internal subdivision of wave (iii) unfolded as a 5 waves impulse. Down from wave (ii), wave i ended at 1794.8 and rally in wave ii ended at 1814. Index resumes lower again in wave iii towards 1733, wave iv rally ended at 1748.80. Final leg wave v ended at 1731.7 which completed wave (iii).
Index then corrected in wave (iv) with internal subdivision as a zigzag Elliott Wave structure. Up from wave (iii), wave a ended at 1762 and wave b pullback ended at 1742.20. Final leg wave c higher ended at 1796.50 which completed wave (iv). Index resumes lower again in wave (v). Down from wave (iv), wave i ended at 1720.4 and wave ii ended at 1778.9. Wave iii ended at 1716.70. Expect wave iv to fail and Index to resume another leg lower to end wave v of (v) of ((i)). Afterwards, Index should rally in wave ((ii)) before it resumes lower again. Near term, as far as pivot at 1825.43 high stays intact, expect rally to fail in 3 ,7, 11 swing for further downside.
Index then corrected in wave (iv) with internal subdivision as a zigzag Elliott Wave structure. Up from wave (iii), wave a ended at 1762 and wave b pullback ended at 1742.20. Final leg wave c higher ended at 1796.50 which completed wave (iv). Index resumes lower again in wave (v). Down from wave (iv), wave i ended at 1720.4 and wave ii ended at 1778.9. Wave iii ended at 1716.70. Expect wave iv to fail and Index to resume another leg lower to end wave v of (v) of ((i)). Afterwards, Index should rally in wave ((ii)) before it resumes lower again. Near term, as far as pivot at 1825.43 high stays intact, expect rally to fail in 3 ,7, 11 swing for further downside.

면책사항
해당 정보와 게시물은 금융, 투자, 트레이딩 또는 기타 유형의 조언이나 권장 사항으로 간주되지 않으며, 트레이딩뷰에서 제공하거나 보증하는 것이 아닙니다. 자세한 내용은 이용 약관을 참조하세요.
면책사항
해당 정보와 게시물은 금융, 투자, 트레이딩 또는 기타 유형의 조언이나 권장 사항으로 간주되지 않으며, 트레이딩뷰에서 제공하거나 보증하는 것이 아닙니다. 자세한 내용은 이용 약관을 참조하세요.