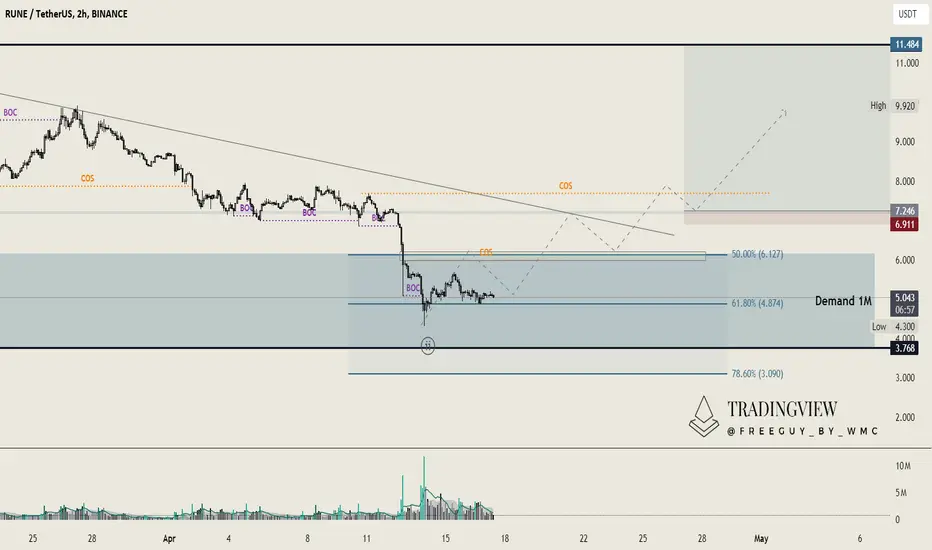
On the two-hour timeframe, the clarity of the market movements for 
 RUNEUSDT becomes even more evident. The end of Wave ((i)) is marked by our high at $11.47. Following this peak, there has been a consistent downtrend, punctuated by a brief corrective phase—this is typical market Elliott Wave behavior.
We potentially have the end of Wave ((ii)) established within the 50% to 78.6% retracement levels. Additionally, a Fair Value Gap (FVG) is marked in yellow on this chart. This scenario presents a second strategic play for Rune.
We would wait for the price to rise, triggering a change in structure. This would involve retesting the trendline and the Fair Value Gap, then breaking out above and re-touching the support zone where we could place our entry.
This strategy would represent a short-term trade opportunity but is quite intriguing due to the dynamics at play on the lower timeframe. It’s feasible that we might follow this plan depending on how the situation develops with Rune.
RUNEUSDT becomes even more evident. The end of Wave ((i)) is marked by our high at $11.47. Following this peak, there has been a consistent downtrend, punctuated by a brief corrective phase—this is typical market Elliott Wave behavior.We potentially have the end of Wave ((ii)) established within the 50% to 78.6% retracement levels. Additionally, a Fair Value Gap (FVG) is marked in yellow on this chart. This scenario presents a second strategic play for Rune.
We would wait for the price to rise, triggering a change in structure. This would involve retesting the trendline and the Fair Value Gap, then breaking out above and re-touching the support zone where we could place our entry.
This strategy would represent a short-term trade opportunity but is quite intriguing due to the dynamics at play on the lower timeframe. It’s feasible that we might follow this plan depending on how the situation develops with Rune.

관련 발행물
면책사항
해당 정보와 게시물은 금융, 투자, 트레이딩 또는 기타 유형의 조언이나 권장 사항으로 간주되지 않으며, 트레이딩뷰에서 제공하거나 보증하는 것이 아닙니다. 자세한 내용은 이용 약관을 참조하세요.
관련 발행물
면책사항
해당 정보와 게시물은 금융, 투자, 트레이딩 또는 기타 유형의 조언이나 권장 사항으로 간주되지 않으며, 트레이딩뷰에서 제공하거나 보증하는 것이 아닙니다. 자세한 내용은 이용 약관을 참조하세요.