
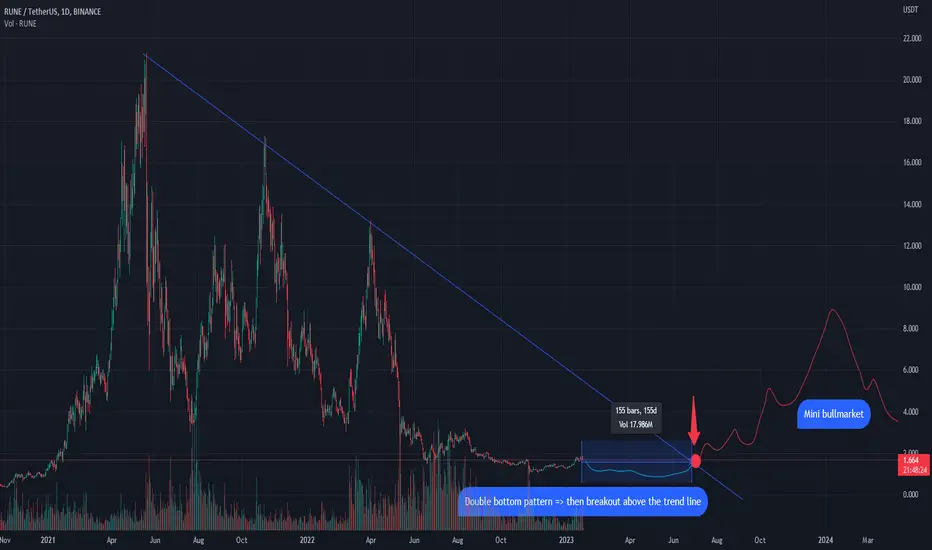
RUNEUSDT chart gives a comprehensive outlook on when the current bear market can probably end and the interim (minor) bullmarket start.
I'm not speaking about the major bullmarket similar to 2020-2021, which obviously is determined by Bitcoin's halving cycles, but rather an interim smaller bullrun with lower highs, which are nevertheless enough to cause high retail demand and money flow.
The downtrend set by the highs of THORChain (Rune) intersects the 'projected' price of RUNE approximately in 6 months, forming a perfect double bottom. This is especially remarkable, since right now we are in an upthrust (bull trap, if we agree with this logic) which may lure many retailers in what they believe is a 'recovery', although it is not.
The fact the the line of the downtrend being projected further forms a second bottom mirroring the already formed one, made me think that this can be an indication of the end of the bear market (when the price breaks above the trendline).
Of course if you look at any other crypto chart, including BTC, you also will be able to see this ~160 day bottom we've gone through by now with a minor upthrust we're currently in, but RUNE is the first chart where I so a second visible confirmation in form of intersection between the end of the second bottom (not yet formed) and the projection of the trend line.
I'm not speaking about the major bullmarket similar to 2020-2021, which obviously is determined by Bitcoin's halving cycles, but rather an interim smaller bullrun with lower highs, which are nevertheless enough to cause high retail demand and money flow.
The downtrend set by the highs of THORChain (Rune) intersects the 'projected' price of RUNE approximately in 6 months, forming a perfect double bottom. This is especially remarkable, since right now we are in an upthrust (bull trap, if we agree with this logic) which may lure many retailers in what they believe is a 'recovery', although it is not.
The fact the the line of the downtrend being projected further forms a second bottom mirroring the already formed one, made me think that this can be an indication of the end of the bear market (when the price breaks above the trendline).
Of course if you look at any other crypto chart, including BTC, you also will be able to see this ~160 day bottom we've gone through by now with a minor upthrust we're currently in, but RUNE is the first chart where I so a second visible confirmation in form of intersection between the end of the second bottom (not yet formed) and the projection of the trend line.
노트
Would be nice to hear other opinions, especially contradicting ones.
면책사항
해당 정보와 게시물은 금융, 투자, 트레이딩 또는 기타 유형의 조언이나 권장 사항으로 간주되지 않으며, 트레이딩뷰에서 제공하거나 보증하는 것이 아닙니다. 자세한 내용은 이용 약관을 참조하세요.
면책사항
해당 정보와 게시물은 금융, 투자, 트레이딩 또는 기타 유형의 조언이나 권장 사항으로 간주되지 않으며, 트레이딩뷰에서 제공하거나 보증하는 것이 아닙니다. 자세한 내용은 이용 약관을 참조하세요.