
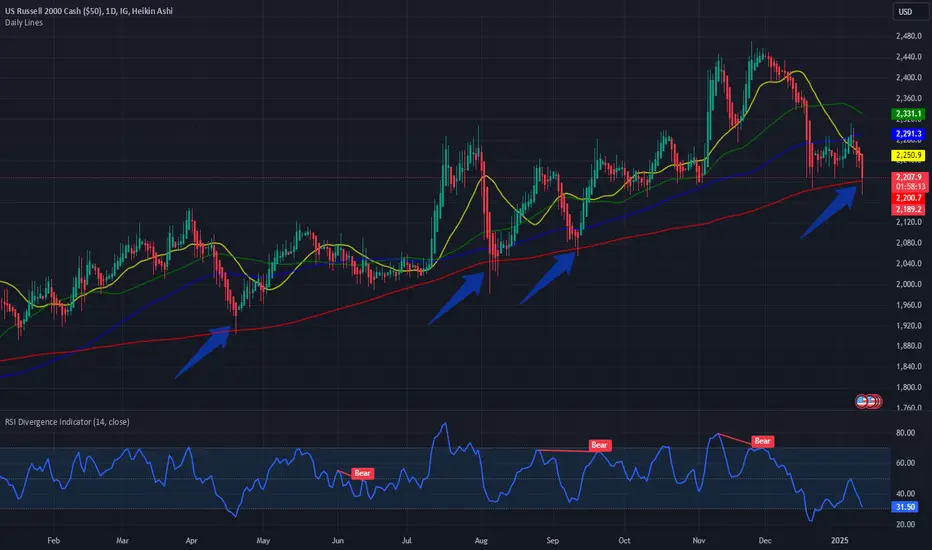
#TGIF. A simple chart to end the week. The US Small Cap index Russel 2000 its just hovering above its 200 Day SMA on the daily chart. Every time this happened in the last 1 year it was a bullish indicator in a medium term. The 50- and 100-Day SMA are below the 20 Day SMA which is a short term bearish indicator.

면책사항
해당 정보와 게시물은 금융, 투자, 트레이딩 또는 기타 유형의 조언이나 권장 사항으로 간주되지 않으며, 트레이딩뷰에서 제공하거나 보증하는 것이 아닙니다. 자세한 내용은 이용 약관을 참조하세요.
면책사항
해당 정보와 게시물은 금융, 투자, 트레이딩 또는 기타 유형의 조언이나 권장 사항으로 간주되지 않으며, 트레이딩뷰에서 제공하거나 보증하는 것이 아닙니다. 자세한 내용은 이용 약관을 참조하세요.