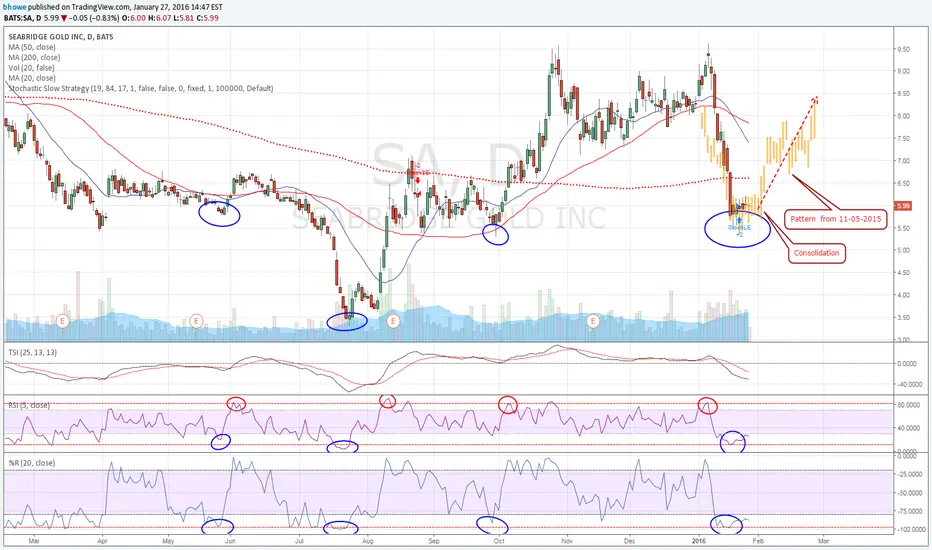
SA looks to be oversold (blue circles) and consolidating. RSI and %R are very oversold. Typically a run up is expected (but not always) into the red circle sell points. Stochastics strategy is indicating a Long Entry (LE). The pattern forming could look like a bear flag, but is very similar to a turn pattern from 11-5-2014 ( see gold bars). TSI looks to be starting a move higher. This is just a possibility. With gold and GDX moving higher I expect SA to join in.

면책사항
해당 정보와 게시물은 금융, 투자, 트레이딩 또는 기타 유형의 조언이나 권장 사항으로 간주되지 않으며, 트레이딩뷰에서 제공하거나 보증하는 것이 아닙니다. 자세한 내용은 이용 약관을 참조하세요.
면책사항
해당 정보와 게시물은 금융, 투자, 트레이딩 또는 기타 유형의 조언이나 권장 사항으로 간주되지 않으며, 트레이딩뷰에서 제공하거나 보증하는 것이 아닙니다. 자세한 내용은 이용 약관을 참조하세요.