
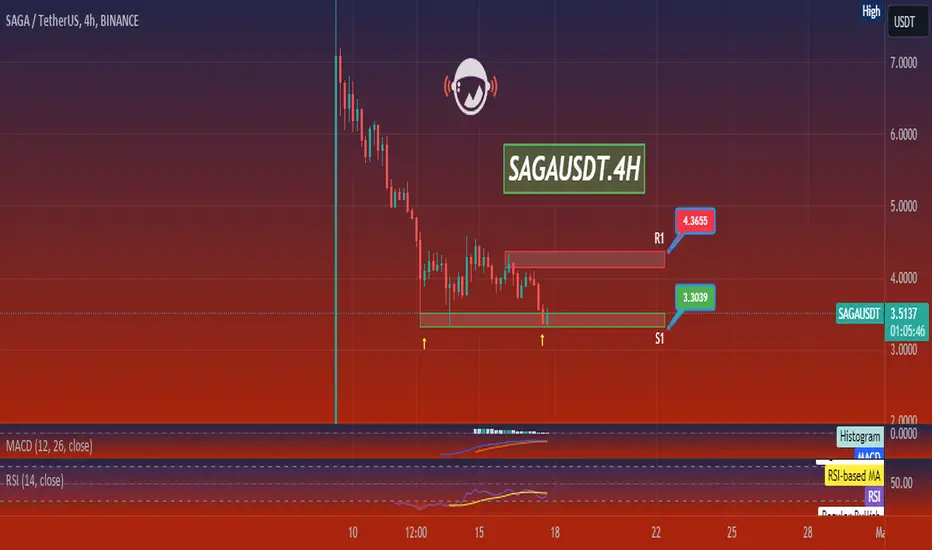
For this SAGA/USDT 4-hour chart, the outlook is quite bearish. The asset is currently trading just above the support level (S1) at $3.3039. If this level does not hold, it could indicate a further drop in price.
The resistance level (R1) is situated at $4.3655. For a change in the current bearish trend, the price would need to break above this resistance level with significant volume to confirm a potential trend reversal.
The RSI is in the oversold territory at 32.87, suggesting that the asset might be undervalued at this point. This could potentially lead to a bounce back if buyers step in, looking for a bargain. However, the RSI being oversold can also persist during strong downtrends.
The MACD is below the baseline and the signal line, reinforcing the bearish sentiment. Yet, traders should remain vigilant for any bullish crossover in the MACD as it may indicate a shift in momentum.
Overall, this chart suggests that caution is warranted. A break below S1 could lead to a further decline, while any bullish signals, such as a rising RSI or MACD crossover, should be closely monitored for signs of a potential reversal. As always, it’s crucial to consider a range of indicators and market news when making trading decisions.
The resistance level (R1) is situated at $4.3655. For a change in the current bearish trend, the price would need to break above this resistance level with significant volume to confirm a potential trend reversal.
The RSI is in the oversold territory at 32.87, suggesting that the asset might be undervalued at this point. This could potentially lead to a bounce back if buyers step in, looking for a bargain. However, the RSI being oversold can also persist during strong downtrends.
The MACD is below the baseline and the signal line, reinforcing the bearish sentiment. Yet, traders should remain vigilant for any bullish crossover in the MACD as it may indicate a shift in momentum.
Overall, this chart suggests that caution is warranted. A break below S1 could lead to a further decline, while any bullish signals, such as a rising RSI or MACD crossover, should be closely monitored for signs of a potential reversal. As always, it’s crucial to consider a range of indicators and market news when making trading decisions.

면책사항
해당 정보와 게시물은 금융, 투자, 트레이딩 또는 기타 유형의 조언이나 권장 사항으로 간주되지 않으며, 트레이딩뷰에서 제공하거나 보증하는 것이 아닙니다. 자세한 내용은 이용 약관을 참조하세요.
면책사항
해당 정보와 게시물은 금융, 투자, 트레이딩 또는 기타 유형의 조언이나 권장 사항으로 간주되지 않으며, 트레이딩뷰에서 제공하거나 보증하는 것이 아닙니다. 자세한 내용은 이용 약관을 참조하세요.