
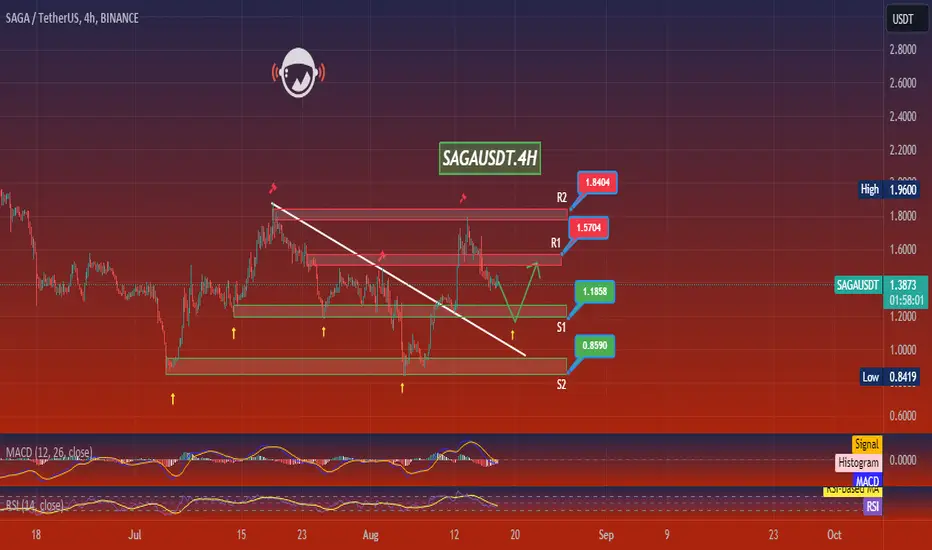
The chart provided for SAGA/USDT on a 4-hour timeframe presents a detailed look at the price movement of Saga against Tether. Let's dive into the analysis based on the information provided in the chart:
Current Situation
Price Level: SAGA is currently trading at $1.4115.
Recent Price Action: The price has shown a mix of upward and downward movements, breaking through a descending trendline, which could signify a shift in momentum.
Support and Resistance Levels
Resistance Levels (R1 and R2):
R1: $1.5704
R2: $1.8404
Support Levels (S1 and S2):
S1: $1.1858
S2: $0.8590
Analysis and Conclusion
From my perspective, the recent breach of the descending trendline is significant. It suggests that the sellers are losing control and the buyers might be gaining strength, especially as the price approaches the resistance level at $1.5704.
Trading Strategy
Bullish Scenario: If SAGA continues its upward momentum and successfully breaks through the resistance at $1.5704, the next target could be $1.8404. It’s crucial to watch for sustained trading volume to support this breakout.
Bearish Scenario: Should SAGA fail to hold above the current support at $1.1858 and breaks below, it might test further lows towards $0.8590. This could indicate a resurgence of selling pressure or a lack of buyer confidence at higher price levels.
Final Thoughts
The market for SAGA shows potential for both continuation of the recent bullish breakout and retracement. As a trader or investor, closely monitoring the price action near these key levels will be essential. Implementing stop-losses just below support levels for long positions could help in managing potential downside risks. Always consider market sentiment and news that may affect SAGA’s price, and ensure that trading decisions align with overall investment strategies and risk tolerance.
Current Situation
Price Level: SAGA is currently trading at $1.4115.
Recent Price Action: The price has shown a mix of upward and downward movements, breaking through a descending trendline, which could signify a shift in momentum.
Support and Resistance Levels
Resistance Levels (R1 and R2):
R1: $1.5704
R2: $1.8404
Support Levels (S1 and S2):
S1: $1.1858
S2: $0.8590
Analysis and Conclusion
From my perspective, the recent breach of the descending trendline is significant. It suggests that the sellers are losing control and the buyers might be gaining strength, especially as the price approaches the resistance level at $1.5704.
Trading Strategy
Bullish Scenario: If SAGA continues its upward momentum and successfully breaks through the resistance at $1.5704, the next target could be $1.8404. It’s crucial to watch for sustained trading volume to support this breakout.
Bearish Scenario: Should SAGA fail to hold above the current support at $1.1858 and breaks below, it might test further lows towards $0.8590. This could indicate a resurgence of selling pressure or a lack of buyer confidence at higher price levels.
Final Thoughts
The market for SAGA shows potential for both continuation of the recent bullish breakout and retracement. As a trader or investor, closely monitoring the price action near these key levels will be essential. Implementing stop-losses just below support levels for long positions could help in managing potential downside risks. Always consider market sentiment and news that may affect SAGA’s price, and ensure that trading decisions align with overall investment strategies and risk tolerance.

면책사항
해당 정보와 게시물은 금융, 투자, 트레이딩 또는 기타 유형의 조언이나 권장 사항으로 간주되지 않으며, 트레이딩뷰에서 제공하거나 보증하는 것이 아닙니다. 자세한 내용은 이용 약관을 참조하세요.
면책사항
해당 정보와 게시물은 금융, 투자, 트레이딩 또는 기타 유형의 조언이나 권장 사항으로 간주되지 않으며, 트레이딩뷰에서 제공하거나 보증하는 것이 아닙니다. 자세한 내용은 이용 약관을 참조하세요.