
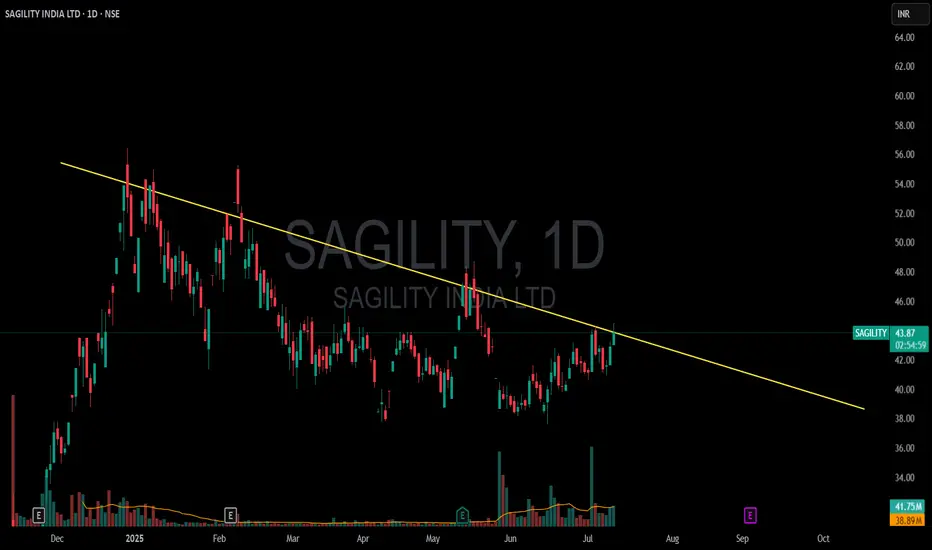
📈 Current Technical & Market Overview
Stock price: ₹43.95 – ₹44 range, with significant trading volumes (~38 million shares)
TradingView
+15
Moneycontrol
+15
The Economic Times
+15
52‑week range: ₹27.02 (low) to ₹56.40 (high – all‑time high)
Investing.com
+2
Investing.com
+2
ICICI Direct
+2
The stock is trading above all its key moving averages (5/20/50/100/200‑day), signaling strong bullish momentum
MarketsMojo
+1
The Economic Times
+1
🔍 Analyst Forecasts
TradingView consensus: ₹59 target (min ₹54, max ₹64)
Munafasutra
+3
TradingView
+3
Screener
+3
TipRanks consensus: ₹58.33 average target — ~33% upside
TipRanks
+1
Munafasutra
+1
AlphaSpread (Wall Street): Average ₹61.2, high-end ₹74.55 — suggesting up to ~68% upside
INDmoney consensus: ₹58.33 target — ~36% upside
Investing.com India
+10
Indmoney
+10
Trendlyne
+10
📰 Recent Events & Concerns
On May 27, 2025, promoter initiated a large stake sale (~₹2,671 Cr) via Offer For Sale, pushing the stock down ~5% to ₹40.70
Investing.com
+2
Investing.com India
+2
The Economic Times
+2
While this added short-term selling pressure, analysts remain optimistic given long-term fundamentals.
🧭 Outlook & Will It Break Its All‑Time High?
Technical strength: Strong upward trend and sustained high volumes – bullish short-to-mid term
Analyst price targets clustering in the ₹58–₹61 range: this would surpass the current high (~₹56), potentially setting a new all-time high.
Recent dip due to promoter selling is likely a short-term event, with support around ₹40–₹42 based on price history.
✅ Summary
Yes, Sagility India is showing strong signs of breaking its previous all-time high (~₹56).
Consensus analyst targets (~₹58–₹61+) imply room to run ~30–38% higher from current levels.
Risks remain: watch for promoter actions, macroeconomic changes, or sector-specific news.
🔎 What You Can Do Now
Watch support levels: ₹40–₹42 is a key short-term support zone.
Set target range: Entry near ₹44, aim for ₹58–₹60.
Monitor volumes & moving averages—continued high volumes above the 50/100 DMA would reinforce the uptrend.
Stay alert to news around promoter stake sale or earnings updates (Q1 performance expected soon).
Disclaimer: The information provided is for educational and informational purposes only and should not be considered as financial advice. Investing in the stock market involves risk, and past performance is not indicative of future results. Please consult with a certified financial advisor or conduct your own research before making any investment decisions. We are not responsible for any losses incurred as a result of using this information. Stock market investments are subject to market risks; read all related documents carefully.
Stock price: ₹43.95 – ₹44 range, with significant trading volumes (~38 million shares)
TradingView
+15
Moneycontrol
+15
The Economic Times
+15
52‑week range: ₹27.02 (low) to ₹56.40 (high – all‑time high)
Investing.com
+2
Investing.com
+2
ICICI Direct
+2
The stock is trading above all its key moving averages (5/20/50/100/200‑day), signaling strong bullish momentum
MarketsMojo
+1
The Economic Times
+1
🔍 Analyst Forecasts
TradingView consensus: ₹59 target (min ₹54, max ₹64)
Munafasutra
+3
TradingView
+3
Screener
+3
TipRanks consensus: ₹58.33 average target — ~33% upside
TipRanks
+1
Munafasutra
+1
AlphaSpread (Wall Street): Average ₹61.2, high-end ₹74.55 — suggesting up to ~68% upside
INDmoney consensus: ₹58.33 target — ~36% upside
Investing.com India
+10
Indmoney
+10
Trendlyne
+10
📰 Recent Events & Concerns
On May 27, 2025, promoter initiated a large stake sale (~₹2,671 Cr) via Offer For Sale, pushing the stock down ~5% to ₹40.70
Investing.com
+2
Investing.com India
+2
The Economic Times
+2
While this added short-term selling pressure, analysts remain optimistic given long-term fundamentals.
🧭 Outlook & Will It Break Its All‑Time High?
Technical strength: Strong upward trend and sustained high volumes – bullish short-to-mid term
Analyst price targets clustering in the ₹58–₹61 range: this would surpass the current high (~₹56), potentially setting a new all-time high.
Recent dip due to promoter selling is likely a short-term event, with support around ₹40–₹42 based on price history.
✅ Summary
Yes, Sagility India is showing strong signs of breaking its previous all-time high (~₹56).
Consensus analyst targets (~₹58–₹61+) imply room to run ~30–38% higher from current levels.
Risks remain: watch for promoter actions, macroeconomic changes, or sector-specific news.
🔎 What You Can Do Now
Watch support levels: ₹40–₹42 is a key short-term support zone.
Set target range: Entry near ₹44, aim for ₹58–₹60.
Monitor volumes & moving averages—continued high volumes above the 50/100 DMA would reinforce the uptrend.
Stay alert to news around promoter stake sale or earnings updates (Q1 performance expected soon).
Disclaimer: The information provided is for educational and informational purposes only and should not be considered as financial advice. Investing in the stock market involves risk, and past performance is not indicative of future results. Please consult with a certified financial advisor or conduct your own research before making any investment decisions. We are not responsible for any losses incurred as a result of using this information. Stock market investments are subject to market risks; read all related documents carefully.

면책사항
해당 정보와 게시물은 금융, 투자, 트레이딩 또는 기타 유형의 조언이나 권장 사항으로 간주되지 않으며, 트레이딩뷰에서 제공하거나 보증하는 것이 아닙니다. 자세한 내용은 이용 약관을 참조하세요.
면책사항
해당 정보와 게시물은 금융, 투자, 트레이딩 또는 기타 유형의 조언이나 권장 사항으로 간주되지 않으며, 트레이딩뷰에서 제공하거나 보증하는 것이 아닙니다. 자세한 내용은 이용 약관을 참조하세요.