
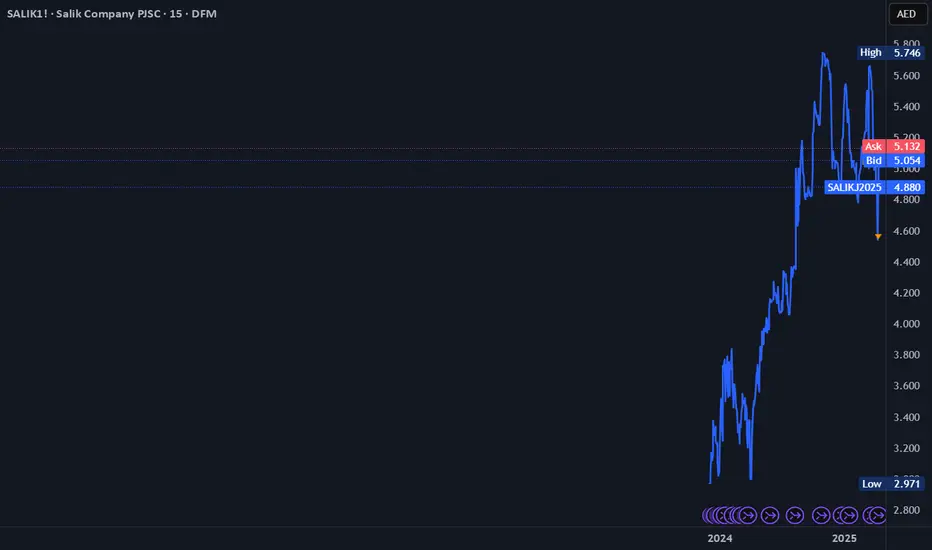
Current Price: AED 5.02
Daily Change: Decrease of AED 0.08 (-1.57%)
52-Week Range:
Low: AED 3.14
High: AED 5.89
Since its IPO in September 2022 at AED 2 per share, Salik has shown impressive growth of approximately 151% to date.
Performance vs. DFMGI (Dubai Financial Market General Index)
Salik has significantly outperformed the Dubai Financial Market Index.
Salik stock: +151% since IPO
DFMGI: Moderate growth over the same period
Technical Analysis
Moving Averages:
These indicators suggest the stock is in a sideways trend, with no clear upward or downward direction.
Support & Resistance Levels
A breakout above the resistance level could signal further gains, while a break below support might indicate potential downside.
Daily Change: Decrease of AED 0.08 (-1.57%)
52-Week Range:
Low: AED 3.14
High: AED 5.89
Since its IPO in September 2022 at AED 2 per share, Salik has shown impressive growth of approximately 151% to date.
Performance vs. DFMGI (Dubai Financial Market General Index)
Salik has significantly outperformed the Dubai Financial Market Index.
Salik stock: +151% since IPO
DFMGI: Moderate growth over the same period
Technical Analysis
- (Relative Strength Index): 51.9 → Neutral (no overbought or oversold signals)
- MACD (Moving Average Convergence Divergence): 0 → Momentum is balanced
- ADX (Average Directional Index): 27.1 → Indicates a weak trend
Moving Averages:
- 5-day MA: AED 5.09 → Buy signal
- 10-day MA: AED 5.06 → Buy signal
- 50-day MA: AED 5.10 → Sell signal
These indicators suggest the stock is in a sideways trend, with no clear upward or downward direction.
Support & Resistance Levels
- Support: AED 5.02
- Resistance: AED 5.18
A breakout above the resistance level could signal further gains, while a break below support might indicate potential downside.

면책사항
해당 정보와 게시물은 금융, 투자, 트레이딩 또는 기타 유형의 조언이나 권장 사항으로 간주되지 않으며, 트레이딩뷰에서 제공하거나 보증하는 것이 아닙니다. 자세한 내용은 이용 약관을 참조하세요.
면책사항
해당 정보와 게시물은 금융, 투자, 트레이딩 또는 기타 유형의 조언이나 권장 사항으로 간주되지 않으며, 트레이딩뷰에서 제공하거나 보증하는 것이 아닙니다. 자세한 내용은 이용 약관을 참조하세요.