
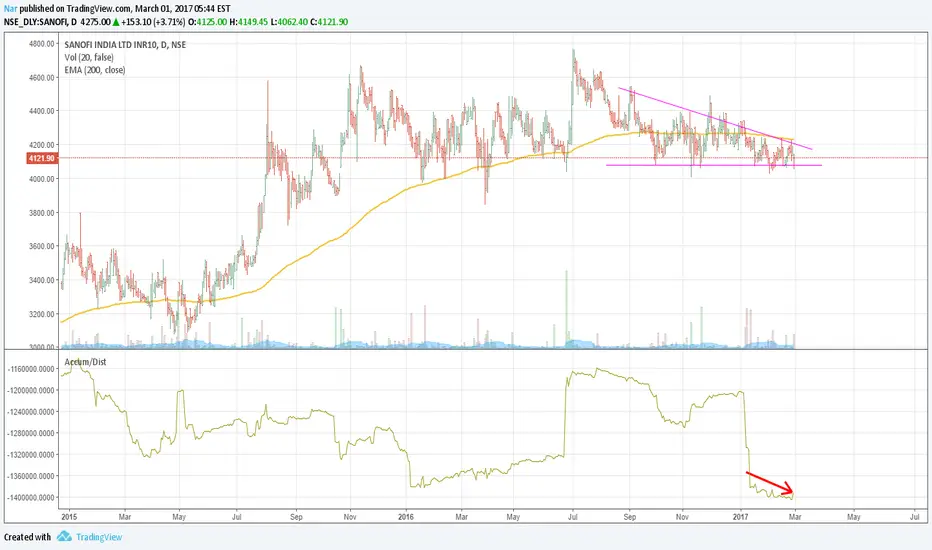
The stock is showing strong support at the 4080 levels. The current pattern shows a descending triangle, constantly testing this support level for the past 3 months. The descending triangle is showing exhaustion as indicated by the Accum/Distribution trend. The A/D is a leading indicator that takes into account volume aspect of the trade as well. One should expect a downward movement to the 3800 levels, followed by a possible bounce back. Fundamentally Sanofi is a good stock currently trading at a P/E of 30.

면책사항
해당 정보와 게시물은 금융, 투자, 트레이딩 또는 기타 유형의 조언이나 권장 사항으로 간주되지 않으며, 트레이딩뷰에서 제공하거나 보증하는 것이 아닙니다. 자세한 내용은 이용 약관을 참조하세요.
면책사항
해당 정보와 게시물은 금융, 투자, 트레이딩 또는 기타 유형의 조언이나 권장 사항으로 간주되지 않으며, 트레이딩뷰에서 제공하거나 보증하는 것이 아닙니다. 자세한 내용은 이용 약관을 참조하세요.