
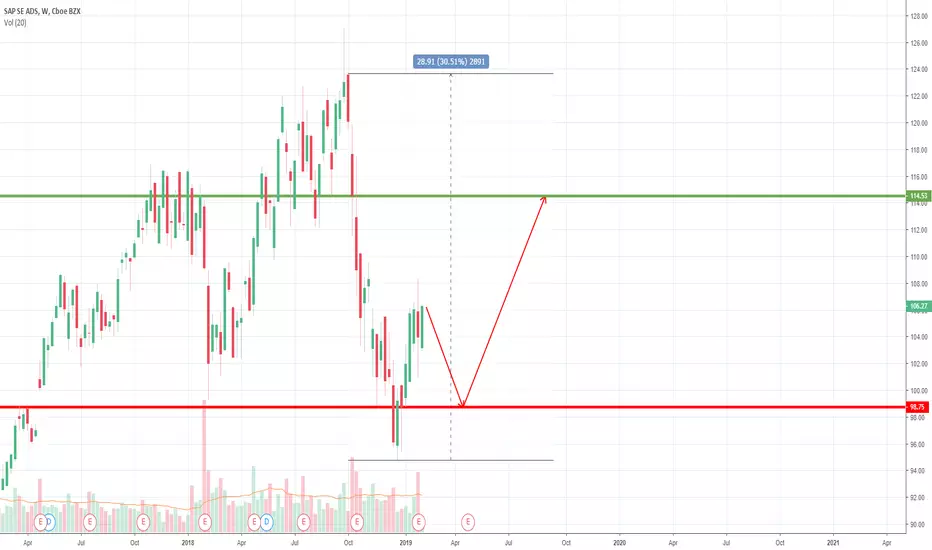
Bearish in short run -to bonce back to around 113 - 114.
Period from: Feb 5 - Sept 20th
Why: When looking at the six month chart it waffles before trending upward or downward. The waffles have become larger. By placing indicators at the end of large buys and sells, this gives you a range of how far the next break out is going to go.
Period from: Feb 5 - Sept 20th
Why: When looking at the six month chart it waffles before trending upward or downward. The waffles have become larger. By placing indicators at the end of large buys and sells, this gives you a range of how far the next break out is going to go.

면책사항
해당 정보와 게시물은 금융, 투자, 트레이딩 또는 기타 유형의 조언이나 권장 사항으로 간주되지 않으며, 트레이딩뷰에서 제공하거나 보증하는 것이 아닙니다. 자세한 내용은 이용 약관을 참조하세요.
면책사항
해당 정보와 게시물은 금융, 투자, 트레이딩 또는 기타 유형의 조언이나 권장 사항으로 간주되지 않으며, 트레이딩뷰에서 제공하거나 보증하는 것이 아닙니다. 자세한 내용은 이용 약관을 참조하세요.