
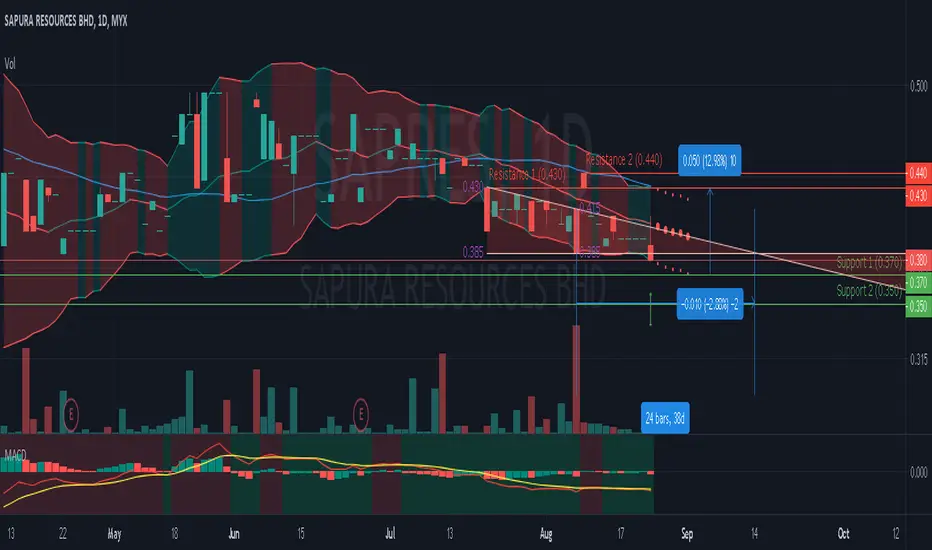
Technically, it is not looking good for SAPRES as its 20-Day Moving Average is sloping downward and its price action is below the Moving Average line.
This is further compounded by the recent bearish breakout of the support level of 0.385.
This breakout was accompanied by a higher than average traded volume which shows the bearishness of the traders to push the price lower and past this support hence pointing to higher probability of a bearish breakout.
Resistance 1 : 0.430 (12.98%)
Resistance 2 : 0.440
Support 1 : 0.370
Support 2 : 0.350
Descending Triangle prediction at 7 Aug 2020.
Possible bearish price movement towards the support 0.370 within the next 38 days (24 bars : ETA 14 Sep 2020).
This is further compounded by the recent bearish breakout of the support level of 0.385.
This breakout was accompanied by a higher than average traded volume which shows the bearishness of the traders to push the price lower and past this support hence pointing to higher probability of a bearish breakout.
Resistance 1 : 0.430 (12.98%)
Resistance 2 : 0.440
Support 1 : 0.370
Support 2 : 0.350
Descending Triangle prediction at 7 Aug 2020.
Possible bearish price movement towards the support 0.370 within the next 38 days (24 bars : ETA 14 Sep 2020).

면책사항
해당 정보와 게시물은 금융, 투자, 트레이딩 또는 기타 유형의 조언이나 권장 사항으로 간주되지 않으며, 트레이딩뷰에서 제공하거나 보증하는 것이 아닙니다. 자세한 내용은 이용 약관을 참조하세요.
면책사항
해당 정보와 게시물은 금융, 투자, 트레이딩 또는 기타 유형의 조언이나 권장 사항으로 간주되지 않으며, 트레이딩뷰에서 제공하거나 보증하는 것이 아닙니다. 자세한 내용은 이용 약관을 참조하세요.