
The Technical Breakdown (Educational Guide)
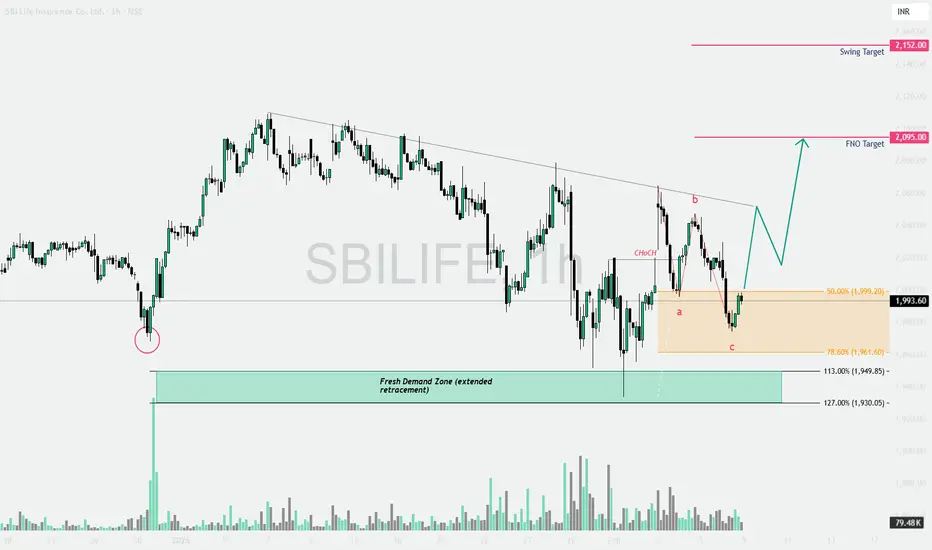
The chart displays a beautiful confluence of Smart Money Concepts (SMC) and Fibonacci retracement. If you’ve been looking for a textbook "Buy the Dip" setup, this is it! Here are 4 key educational points from this chart:
1. The Choch (Change of Character) ⚡
Notice the label CHoCH on the chart. This occurs when the price breaks the recent lower high in a downtrend. It’s the first signal that the "character" of the market is shifting from Bearish to Bullish. It’s not a full trend reversal yet, but it’s the early warning sign smart traders look for.
2. The ABC Correction Pattern 🔀
After the initial impulsive move up (from the circle), the price entered a three-wave corrective phase labeled a-b-c.
Wave A & B: Short-term volatility.
Wave C: The final "flush out" that traps impatient sellers before the real move starts.
3. Fibonacci "Golden Zone" Confluence 🎯
The price has dipped exactly into the 50.0% (1,999.20) to 78.6% (1,961.60) retracement zone.
This orange box acts as a High-Interest Buy Zone.
Below this, we have a Fresh Demand Zone (extended retracement) between 1,930 – 1,950 for extra safety.
4. Trendline Breakout Anticipation 📉
The grey descending trendline has been capping price for weeks. A breakout above this line, followed by a successful retest, confirms the FNO Target of 2,095 and the Swing Target of 2,152.
📊 Trade Setup Summary
Current Price: ~1,993.60
Entry Zone: 1,960 — 1,995 (Accumulation Zone)
Immediate Target (FNO): 2,095 🎯
Positional Target (Swing): 2,152 🚀
Invalidation: A sustained close below the Fresh Demand Zone (1,930).
⚠️ Disclaimer
This analysis is strictly for educational purposes only.
I am not a SEBI registered analyst.
Please consult your financial advisor before taking any trades.
Market investments are subject to risk.
The chart displays a beautiful confluence of Smart Money Concepts (SMC) and Fibonacci retracement. If you’ve been looking for a textbook "Buy the Dip" setup, this is it! Here are 4 key educational points from this chart:
1. The Choch (Change of Character) ⚡
Notice the label CHoCH on the chart. This occurs when the price breaks the recent lower high in a downtrend. It’s the first signal that the "character" of the market is shifting from Bearish to Bullish. It’s not a full trend reversal yet, but it’s the early warning sign smart traders look for.
2. The ABC Correction Pattern 🔀
After the initial impulsive move up (from the circle), the price entered a three-wave corrective phase labeled a-b-c.
Wave A & B: Short-term volatility.
Wave C: The final "flush out" that traps impatient sellers before the real move starts.
3. Fibonacci "Golden Zone" Confluence 🎯
The price has dipped exactly into the 50.0% (1,999.20) to 78.6% (1,961.60) retracement zone.
This orange box acts as a High-Interest Buy Zone.
Below this, we have a Fresh Demand Zone (extended retracement) between 1,930 – 1,950 for extra safety.
4. Trendline Breakout Anticipation 📉
The grey descending trendline has been capping price for weeks. A breakout above this line, followed by a successful retest, confirms the FNO Target of 2,095 and the Swing Target of 2,152.
📊 Trade Setup Summary
Current Price: ~1,993.60
Entry Zone: 1,960 — 1,995 (Accumulation Zone)
Immediate Target (FNO): 2,095 🎯
Positional Target (Swing): 2,152 🚀
Invalidation: A sustained close below the Fresh Demand Zone (1,930).
⚠️ Disclaimer
This analysis is strictly for educational purposes only.
I am not a SEBI registered analyst.
Please consult your financial advisor before taking any trades.
Market investments are subject to risk.
거래청산: 타겟 닿음
First FNO Target Achieved
면책사항
해당 정보와 게시물은 금융, 투자, 트레이딩 또는 기타 유형의 조언이나 권장 사항으로 간주되지 않으며, 트레이딩뷰에서 제공하거나 보증하는 것이 아닙니다. 자세한 내용은 이용 약관을 참조하세요.
면책사항
해당 정보와 게시물은 금융, 투자, 트레이딩 또는 기타 유형의 조언이나 권장 사항으로 간주되지 않으며, 트레이딩뷰에서 제공하거나 보증하는 것이 아닙니다. 자세한 내용은 이용 약관을 참조하세요.