
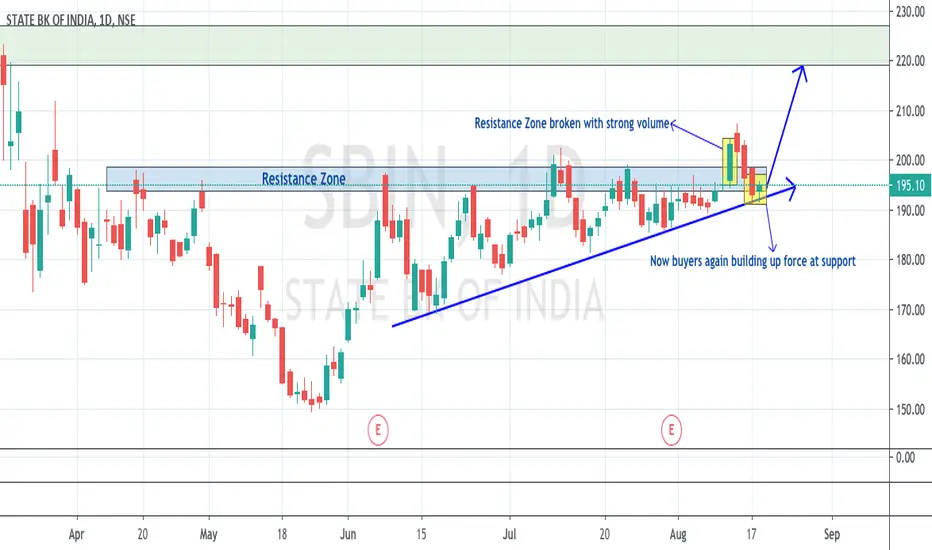
It has been observed that the price action formed a ascending triangle on chart and then breaks a strong bullish candlestick breaks above the ascending triangle and the resistance zone. Then the price action falls back to support where bullish buyers showed buying again indicating a further move up.
Expected Target: T-210, 220 & SL - 190 (1:3, 1:5)
Expected Target: T-210, 220 & SL - 190 (1:3, 1:5)
액티브 트레이드
거래청산: 타겟 닿음
It was a good smooth ride towards the targets. Price action reached All targets on Friday session itself.
관련 발행물
면책사항
해당 정보와 게시물은 금융, 투자, 트레이딩 또는 기타 유형의 조언이나 권장 사항으로 간주되지 않으며, 트레이딩뷰에서 제공하거나 보증하는 것이 아닙니다. 자세한 내용은 이용 약관을 참조하세요.
면책사항
해당 정보와 게시물은 금융, 투자, 트레이딩 또는 기타 유형의 조언이나 권장 사항으로 간주되지 않으며, 트레이딩뷰에서 제공하거나 보증하는 것이 아닙니다. 자세한 내용은 이용 약관을 참조하세요.