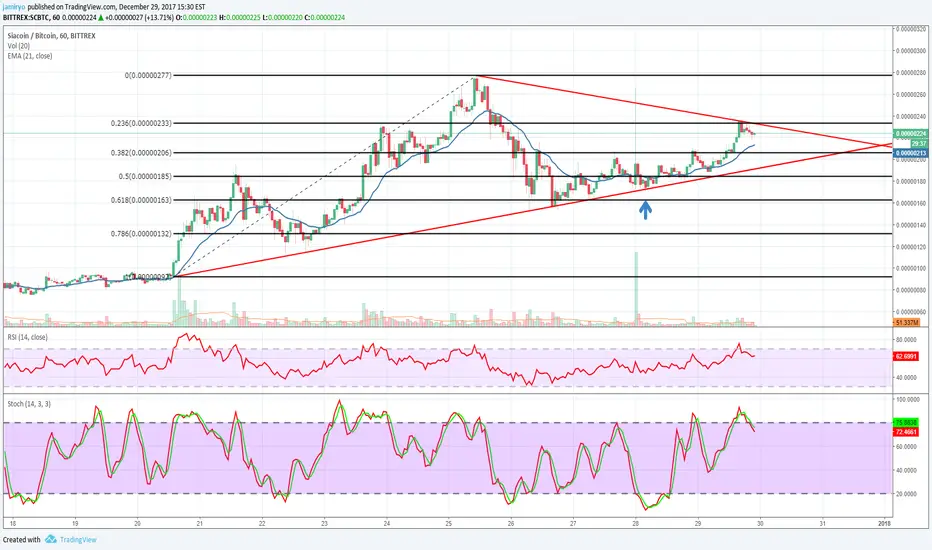
Possible support and resistance are marked in the graph. looks like it is in a downtrend for short term interval.
If it stays above the blue EMA, I think there is no big problem.
If it can break the triangles above resistance (red line) target will be 277 to make a cup formation.
If it stays above the blue EMA, I think there is no big problem.
If it can break the triangles above resistance (red line) target will be 277 to make a cup formation.
노트
it broke the triangle, now it is on the pull back zone. it turned from the 233 level to take the pull back action. this prices are important I think. Must stay above the trend support zone (red line marked with blue arrow) for the upward movement.
액티브 트레이드
It looks like that it is moving in a horizontal channel between 206 and 233.I think the break point of this channel will show us the direction of the move. Indicators shows that it is looking to find a direction to itself.

면책사항
해당 정보와 게시물은 금융, 투자, 트레이딩 또는 기타 유형의 조언이나 권장 사항으로 간주되지 않으며, 트레이딩뷰에서 제공하거나 보증하는 것이 아닙니다. 자세한 내용은 이용 약관을 참조하세요.
면책사항
해당 정보와 게시물은 금융, 투자, 트레이딩 또는 기타 유형의 조언이나 권장 사항으로 간주되지 않으며, 트레이딩뷰에서 제공하거나 보증하는 것이 아닙니다. 자세한 내용은 이용 약관을 참조하세요.