Siacoin Double Bottom
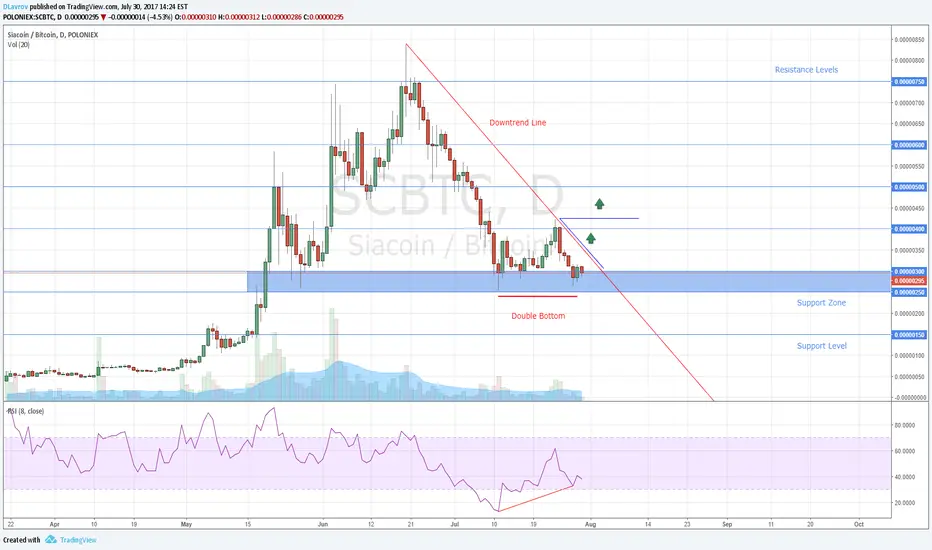
If we look at the daily chart of Siacoin, we can see that the market is at the support zone. Bullish divergence and double bottom chart pattern give us a trend reversal signal. It means that we have to be ready to open long trades based on breakout signals. If price bounces from the support zone and breaks the downtrend line, it will be confirmation for further upward movement. We'll be able to open long trades with stop orders below the support zone. The next confirmation for the upward movement will be a breakout above the previous swing high. If price can break this level, we'll have a new buy signal and confirmation for the up trend. We'll be able to add some volume to the previous long positions. Profit targets for long trades should be at resistance levels. If the market breaks the support zone, we'll see downward movement to the support level and new trading opportunity.

💰COPY MY TRADES FOR FREE! Join 👉 bit.ly/41DKDBD
📣 Get Welcome Bonuses for 1st Trade 👉 bit.ly/bonus_bybit
💎 Share My BEST Trades here 👉 bit.ly/wubits
📣 Get Welcome Bonuses for 1st Trade 👉 bit.ly/bonus_bybit
💎 Share My BEST Trades here 👉 bit.ly/wubits
면책사항
해당 정보와 게시물은 금융, 투자, 트레이딩 또는 기타 유형의 조언이나 권장 사항으로 간주되지 않으며, 트레이딩뷰에서 제공하거나 보증하는 것이 아닙니다. 자세한 내용은 이용 약관을 참조하세요.