Long
SCBTC forming bullish Shark | Upto 142% Move ahead
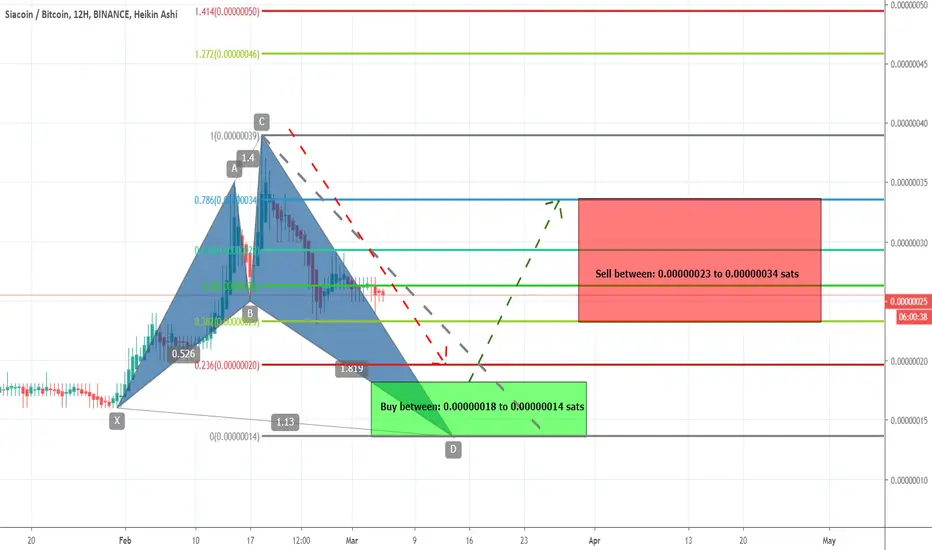
Hi friends hope you are well, here I have found another profit potential trading idea for you and this time on 12 hour chart the Siacoin (SC) is forming bullish Shark pattern and soon it will be entered in potential reversal zone to move up.
The Pattern:
After initial leg (X to A) the A to B leg is retraced between 0.382 to 0.618 Fibonacci and then B to C leg is projected between 1.13 to 1.618 of A to B Fibonacci projection area and last leg (C to D) should be retraced between 0.886 to 1.13 Fibonacci then the priceline will be ready to take bullish or upwards move.
Buying And Sell Targets:
The buying and sell targets according to harmonic BAT pattern should be:
Buy between: 0.00000018 to 0.00000014
Sell between: 0.00000023 to 0.00000034
Stop Loss:
The potential reversal zone area which is up to to 0.00000014 can be used as stop loss in case of complete candle stick closes below this level.
The Pattern:
After initial leg (X to A) the A to B leg is retraced between 0.382 to 0.618 Fibonacci and then B to C leg is projected between 1.13 to 1.618 of A to B Fibonacci projection area and last leg (C to D) should be retraced between 0.886 to 1.13 Fibonacci then the priceline will be ready to take bullish or upwards move.
Buying And Sell Targets:
The buying and sell targets according to harmonic BAT pattern should be:
Buy between: 0.00000018 to 0.00000014
Sell between: 0.00000023 to 0.00000034
Stop Loss:
The potential reversal zone area which is up to to 0.00000014 can be used as stop loss in case of complete candle stick closes below this level.
거래청산: 타겟 닿음
By the grace of Allah the most high this trade plan produced more than 50% rally
관련 발행물
면책사항
해당 정보와 게시물은 금융, 투자, 트레이딩 또는 기타 유형의 조언이나 권장 사항으로 간주되지 않으며, 트레이딩뷰에서 제공하거나 보증하는 것이 아닙니다. 자세한 내용은 이용 약관을 참조하세요.
관련 발행물
면책사항
해당 정보와 게시물은 금융, 투자, 트레이딩 또는 기타 유형의 조언이나 권장 사항으로 간주되지 않으며, 트레이딩뷰에서 제공하거나 보증하는 것이 아닙니다. 자세한 내용은 이용 약관을 참조하세요.