
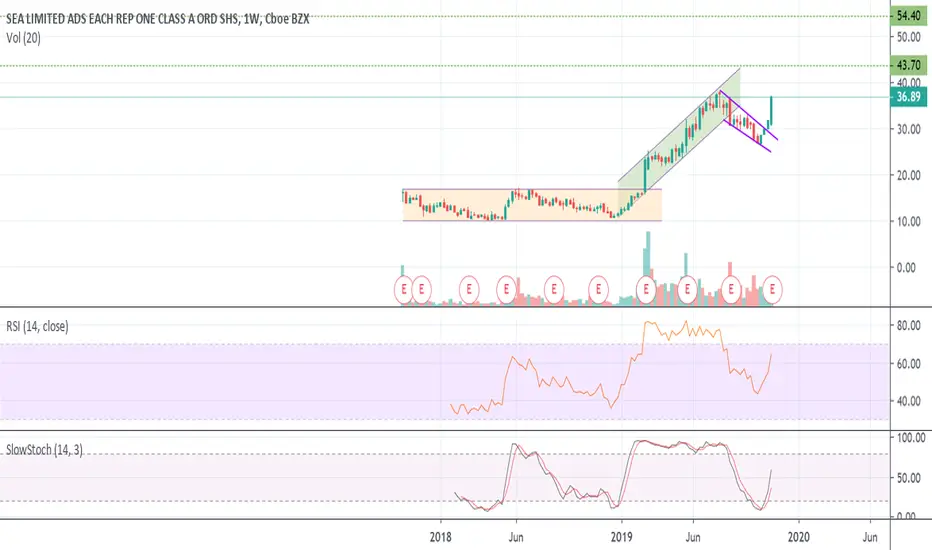
Looking at the weekly chart we can see the initial consolidation following their IPO. We finally saw a bullish breakout at the end of February which led to an ascending channel that held until August. The recent pullback could've been interpreted as a bull flag pattern that just had a bullish breakout last week as they were preparing for earnings. After releasing an amazing earnings announcement the stock has gapped up over 18% as I write this.
I have noted my price targets using the 61.8% & 100% Fibonacci Extension levels.
I have noted my price targets using the 61.8% & 100% Fibonacci Extension levels.

면책사항
해당 정보와 게시물은 금융, 투자, 트레이딩 또는 기타 유형의 조언이나 권장 사항으로 간주되지 않으며, 트레이딩뷰에서 제공하거나 보증하는 것이 아닙니다. 자세한 내용은 이용 약관을 참조하세요.
면책사항
해당 정보와 게시물은 금융, 투자, 트레이딩 또는 기타 유형의 조언이나 권장 사항으로 간주되지 않으며, 트레이딩뷰에서 제공하거나 보증하는 것이 아닙니다. 자세한 내용은 이용 약관을 참조하세요.