
Trade Bias: Long
Chart Analysis:
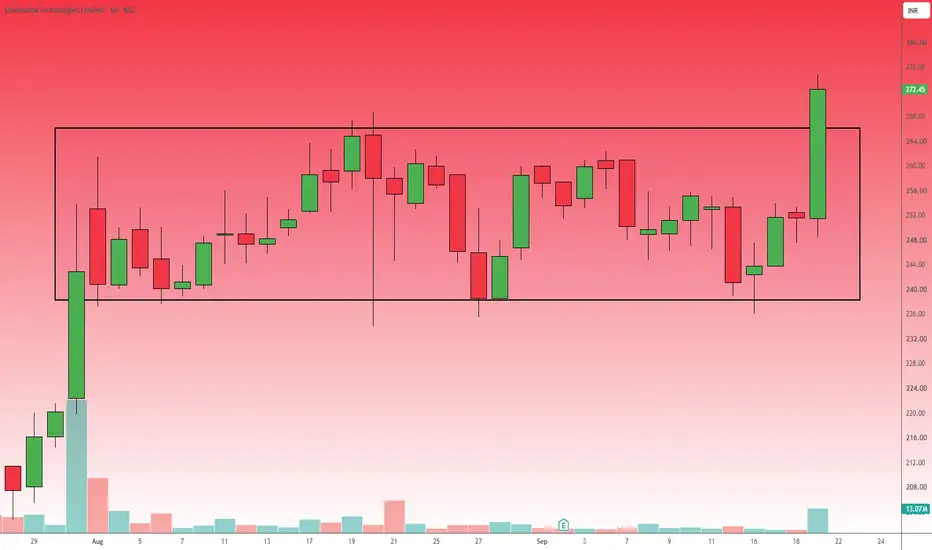
As observed in Shadowfax Technologies has spent several weeks consolidating within a clear rectangular channel, bounded by support around 240.00 and resistance near 264.00.
The most recent daily price action demonstrates a definitive breakout above this resistance zone, printing a strong, full-bodied bullish candle that closed at 272.45 (+8.31%).
To satisfy the requirement of multiple technical confirmations, this pattern breakout is heavily supported by a massive volume spike (13.07M).
The combination of a structural resistance breach and unusually high buying volume suggests strong underlying momentum.
Trade Parameters:
Entry Point: Current market price near 272.45 is viable for momentum traders.
Alternatively, conservative traders can look for a slight pullback to the 264.00 level, which should now act as flipped support.
Target : 288.00 – 295.00.
The primary target is calculated using the measured move technique: taking the height of the consolidation box (24 points) and projecting it upward from the 264.00 breakout level.
Stop Loss: 255.00.
Placing a stop loss below the midpoint of the breakout candle protects capital in the event of a false breakout or "bull trap".
Estimated Horizon: Short to medium term (1 to 4 weeks).
Chart Analysis:
As observed in Shadowfax Technologies has spent several weeks consolidating within a clear rectangular channel, bounded by support around 240.00 and resistance near 264.00.
The most recent daily price action demonstrates a definitive breakout above this resistance zone, printing a strong, full-bodied bullish candle that closed at 272.45 (+8.31%).
To satisfy the requirement of multiple technical confirmations, this pattern breakout is heavily supported by a massive volume spike (13.07M).
The combination of a structural resistance breach and unusually high buying volume suggests strong underlying momentum.
Trade Parameters:
Entry Point: Current market price near 272.45 is viable for momentum traders.
Alternatively, conservative traders can look for a slight pullback to the 264.00 level, which should now act as flipped support.
Target : 288.00 – 295.00.
The primary target is calculated using the measured move technique: taking the height of the consolidation box (24 points) and projecting it upward from the 264.00 breakout level.
Stop Loss: 255.00.
Placing a stop loss below the midpoint of the breakout candle protects capital in the event of a false breakout or "bull trap".
Estimated Horizon: Short to medium term (1 to 4 weeks).

면책사항
해당 정보와 게시물은 금융, 투자, 트레이딩 또는 기타 유형의 조언이나 권장 사항으로 간주되지 않으며, 트레이딩뷰에서 제공하거나 보증하는 것이 아닙니다. 자세한 내용은 이용 약관을 참조하세요.
면책사항
해당 정보와 게시물은 금융, 투자, 트레이딩 또는 기타 유형의 조언이나 권장 사항으로 간주되지 않으며, 트레이딩뷰에서 제공하거나 보증하는 것이 아닙니다. 자세한 내용은 이용 약관을 참조하세요.