
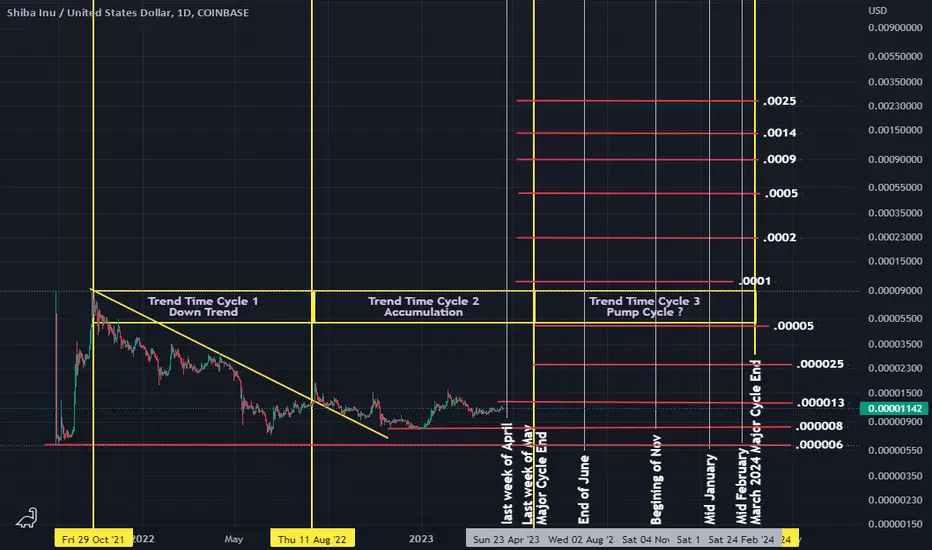
Many alt coins are reaching the end of what appears to be an accumulation cycle. We have an obvious long running down trend followed buy an equal distance of sideways accumulation. Next step is typically an equal length time cycle to the upside.
Price can only trend in 3 directions. It can trend down, trend sideways in a range, or it can trend upward.
Typically after a major down trend followed by a sideways range starting to up trend we see an uptrend of the same length.
The chart is measureing the amount of time it took to complete one trend to show potential time periods we would expect the next major pivot. One should occur by the end of may and the next early 2024.
Hopefully it is an uptrend.
There is no way of know what price shib will reach this cycle but using averages based on the past price action we can make an educated guess as to what levels are possible.
We expect the accumulation cycle to end in the next few weeks the question is what trend will we see in the next cycle?
Price can only trend in 3 directions. It can trend down, trend sideways in a range, or it can trend upward.
Typically after a major down trend followed by a sideways range starting to up trend we see an uptrend of the same length.
The chart is measureing the amount of time it took to complete one trend to show potential time periods we would expect the next major pivot. One should occur by the end of may and the next early 2024.
Hopefully it is an uptrend.
There is no way of know what price shib will reach this cycle but using averages based on the past price action we can make an educated guess as to what levels are possible.
We expect the accumulation cycle to end in the next few weeks the question is what trend will we see in the next cycle?
노트
Brake out time?노트
well... it did
면책사항
해당 정보와 게시물은 금융, 투자, 트레이딩 또는 기타 유형의 조언이나 권장 사항으로 간주되지 않으며, 트레이딩뷰에서 제공하거나 보증하는 것이 아닙니다. 자세한 내용은 이용 약관을 참조하세요.
면책사항
해당 정보와 게시물은 금융, 투자, 트레이딩 또는 기타 유형의 조언이나 권장 사항으로 간주되지 않으며, 트레이딩뷰에서 제공하거나 보증하는 것이 아닙니다. 자세한 내용은 이용 약관을 참조하세요.