
Shiba Inu (SHIB) technical analysis:
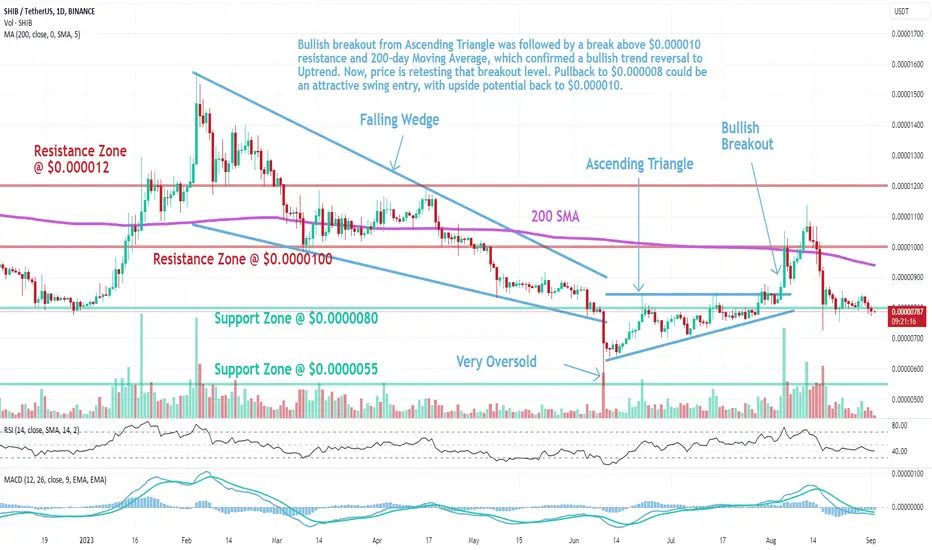
Trade setup: Bullish breakout from Ascending Triangle was followed by a break above $0.000010 resistance and 200-day Moving Average, which confirmed a bullish trend reversal to Uptrend. Now, price is retesting that breakout level. Pullback to $0.000008 could be an attractive swing entry, with upside potential back to $0.000010.
Trend: Downtrend on Short- and Medium-Term basis and Neutral on Long-Term basis.
Momentum is Bearish but inflecting. MACD Line is below MACD Signal Line and RSI is below 45 but momentum may have bottomed since MACD Histogram bars are rising, which suggests that momentum could be nearing another upswing.
Support and Resistance: Nearest Support Zone is $0.0000080 (previous resistance), then $0.0000055. The nearest Resistance Zone is $0.0000100, then $0.00001200.
Trade setup: Bullish breakout from Ascending Triangle was followed by a break above $0.000010 resistance and 200-day Moving Average, which confirmed a bullish trend reversal to Uptrend. Now, price is retesting that breakout level. Pullback to $0.000008 could be an attractive swing entry, with upside potential back to $0.000010.
Trend: Downtrend on Short- and Medium-Term basis and Neutral on Long-Term basis.
Momentum is Bearish but inflecting. MACD Line is below MACD Signal Line and RSI is below 45 but momentum may have bottomed since MACD Histogram bars are rising, which suggests that momentum could be nearing another upswing.
Support and Resistance: Nearest Support Zone is $0.0000080 (previous resistance), then $0.0000055. The nearest Resistance Zone is $0.0000100, then $0.00001200.

면책사항
해당 정보와 게시물은 금융, 투자, 트레이딩 또는 기타 유형의 조언이나 권장 사항으로 간주되지 않으며, 트레이딩뷰에서 제공하거나 보증하는 것이 아닙니다. 자세한 내용은 이용 약관을 참조하세요.
면책사항
해당 정보와 게시물은 금융, 투자, 트레이딩 또는 기타 유형의 조언이나 권장 사항으로 간주되지 않으며, 트레이딩뷰에서 제공하거나 보증하는 것이 아닙니다. 자세한 내용은 이용 약관을 참조하세요.