
Hello?
Traders, welcome.
If you "Follow", you can always get new information quickly.
Please also click "Boost".
Have a good day.
-------------------------------------
(SHIBUSDT chart)

(1W chart)

The key is whether you can rise with support within the section consisting of the HA-Low and HA-High indicators.
To do that, we need to make sure we can get support around 0.0000 1003 to 0.0000 1098.
(1D chart)

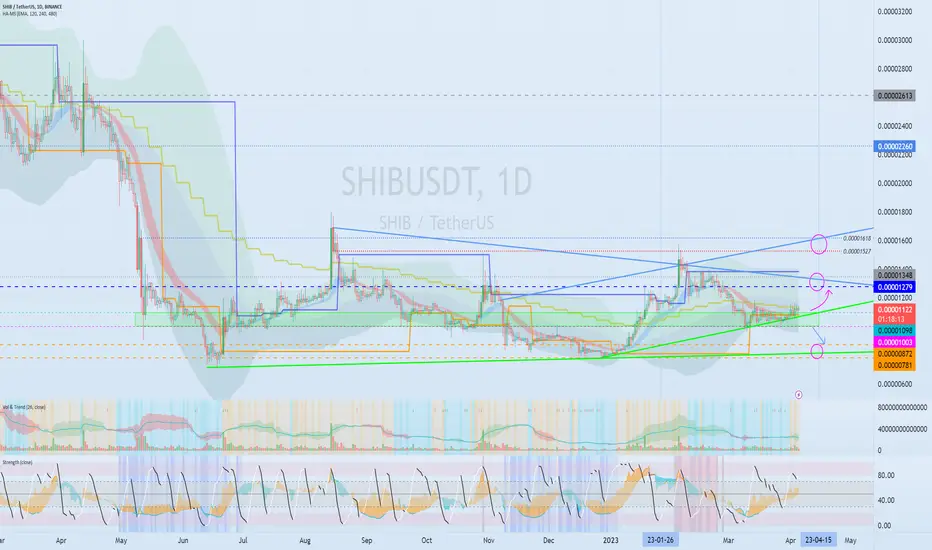
It is sideways in the range of 0.0000 0872 to 0.0000 1279.
It is important to be supported and able to rise in the middle of this sideways section, around 0.0000 1003 to 0.0000 1098.
If the price stays above the 0.0000 1279 - 0.0000 1348 range, I would expect it to lead to an attempt to break above the 0.0000 1527 - 0.0000 1618 area.
If it rises above the 0.0000 1527 ~ 0.0000 1618 section, I think it is highly likely to show a full-fledged uptrend.
-------------------------------------------------- -------------------------------------------
** All descriptions are for reference only and do not guarantee profit or loss in investment.
** Even if you know other people's know-how, it takes a considerable period of time to make it your own.
** This is a chart created with my know-how.
---------------------------------
Traders, welcome.
If you "Follow", you can always get new information quickly.
Please also click "Boost".
Have a good day.
-------------------------------------
(SHIBUSDT chart)
(1W chart)
The key is whether you can rise with support within the section consisting of the HA-Low and HA-High indicators.
To do that, we need to make sure we can get support around 0.0000 1003 to 0.0000 1098.
(1D chart)
It is sideways in the range of 0.0000 0872 to 0.0000 1279.
It is important to be supported and able to rise in the middle of this sideways section, around 0.0000 1003 to 0.0000 1098.
If the price stays above the 0.0000 1279 - 0.0000 1348 range, I would expect it to lead to an attempt to break above the 0.0000 1527 - 0.0000 1618 area.
If it rises above the 0.0000 1527 ~ 0.0000 1618 section, I think it is highly likely to show a full-fledged uptrend.
-------------------------------------------------- -------------------------------------------
** All descriptions are for reference only and do not guarantee profit or loss in investment.
** Even if you know other people's know-how, it takes a considerable period of time to make it your own.
** This is a chart created with my know-how.
---------------------------------

YouTube: youtube.com/@readcrypto9837
※ Follow X to check out the posts.
※ X를 팔로우하고 게시물을 확인하세요.
◆ t.me/readCryptoChannel
[HA-MS Indicator]
bit.ly/3YxHgvN
[OBV Indicator]
bit.ly/4dcyny3
※ Follow X to check out the posts.
※ X를 팔로우하고 게시물을 확인하세요.
◆ t.me/readCryptoChannel
[HA-MS Indicator]
bit.ly/3YxHgvN
[OBV Indicator]
bit.ly/4dcyny3
관련 발행물
면책사항
해당 정보와 게시물은 금융, 투자, 트레이딩 또는 기타 유형의 조언이나 권장 사항으로 간주되지 않으며, 트레이딩뷰에서 제공하거나 보증하는 것이 아닙니다. 자세한 내용은 이용 약관을 참조하세요.
YouTube: youtube.com/@readcrypto9837
※ Follow X to check out the posts.
※ X를 팔로우하고 게시물을 확인하세요.
◆ t.me/readCryptoChannel
[HA-MS Indicator]
bit.ly/3YxHgvN
[OBV Indicator]
bit.ly/4dcyny3
※ Follow X to check out the posts.
※ X를 팔로우하고 게시물을 확인하세요.
◆ t.me/readCryptoChannel
[HA-MS Indicator]
bit.ly/3YxHgvN
[OBV Indicator]
bit.ly/4dcyny3
관련 발행물
면책사항
해당 정보와 게시물은 금융, 투자, 트레이딩 또는 기타 유형의 조언이나 권장 사항으로 간주되지 않으며, 트레이딩뷰에서 제공하거나 보증하는 것이 아닙니다. 자세한 내용은 이용 약관을 참조하세요.