롱
$SHOP Towards $70
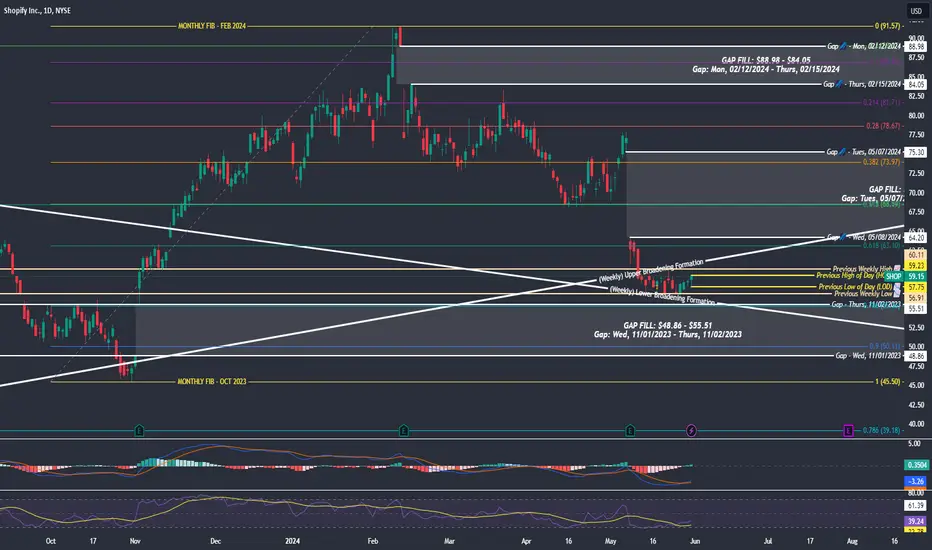
What do we see here?
- $NYSE:SHOP ended the day with a bullish outside day.
- Previous HOD for May 31 is $59.23, can serve as resistance.
- Previous weekly high is $60.11 and can also serve as resistance.
- GAP to be filled to the upside $64.20 - $75.30.
- RSI is at 39.24 and moving upwards slowly.
- MACD (blue line) is above the signal (orange line), indicates continued bullish movement
- 5-month monthly fibonacci patterns highlights potential resistance on 0.618 ($63.10) and 0.5 ($68.54) (which is the 0.618 of a bullish fib pattern on a larger time block
- GAP also potentially to be filled to the downside $55.51 - $48.86)

관련 발행물
면책사항
해당 정보와 게시물은 금융, 투자, 트레이딩 또는 기타 유형의 조언이나 권장 사항으로 간주되지 않으며, 트레이딩뷰에서 제공하거나 보증하는 것이 아닙니다. 자세한 내용은 이용 약관을 참조하세요.
면책사항
해당 정보와 게시물은 금융, 투자, 트레이딩 또는 기타 유형의 조언이나 권장 사항으로 간주되지 않으며, 트레이딩뷰에서 제공하거나 보증하는 것이 아닙니다. 자세한 내용은 이용 약관을 참조하세요.