
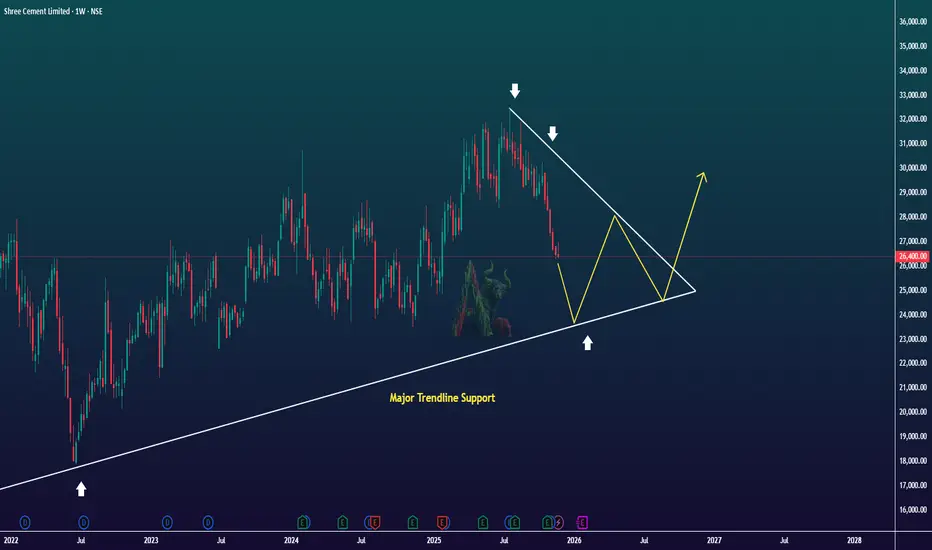
Price is approaching a broad trendline support while forming a descending triangle on the upper side. Weekly structure shows compression. We can expect a possible strong move ahead once it reaches the major support zone. As of now watch the trendline.
Break down = momentum shift in the downward direction
Bounce = continuation to the upside
Break down = momentum shift in the downward direction
Bounce = continuation to the upside
액티브 트레이드
거래청산: 타겟 닿음

면책사항
해당 정보와 게시물은 금융, 투자, 트레이딩 또는 기타 유형의 조언이나 권장 사항으로 간주되지 않으며, 트레이딩뷰에서 제공하거나 보증하는 것이 아닙니다. 자세한 내용은 이용 약관을 참조하세요.
면책사항
해당 정보와 게시물은 금융, 투자, 트레이딩 또는 기타 유형의 조언이나 권장 사항으로 간주되지 않으며, 트레이딩뷰에서 제공하거나 보증하는 것이 아닙니다. 자세한 내용은 이용 약관을 참조하세요.