
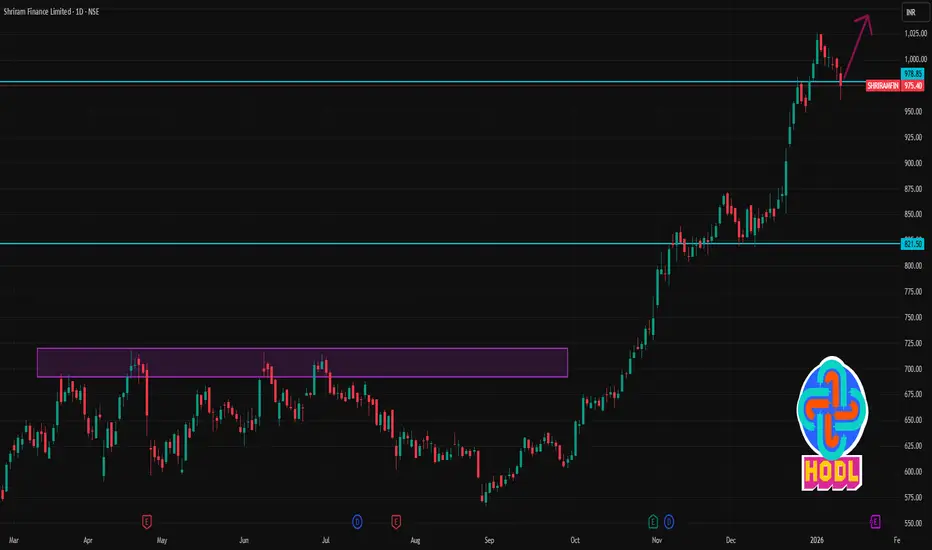
📈 Current Stock Price Snapshot
Latest Price: ~₹975–₹987 range (varies with live trading) — recent data shows around ₹975 – ₹987 on daily charts.
📊 Daily Pivot & Levels (1-Day Timeframe)
These are calculated from the previous trading session’s high/low/close and act as key intraday reference points:
🔹 Pivot Point (Central): ~₹976.50
📈 Resistance Levels:
R1: ~ ₹992–₹1,008
R2: ~ ₹1,008–₹1,024
R3: ~ ₹1,024+
📉 Support Levels:
S1: ~ ₹964–₹970
S2: ~ ₹959–₹960
S3: ~ ₹944–₹952
How to interpret:
Above Pivot (~₹976.50) → bullish bias for the day.
Below Pivot → neutral to bearish intraday mode.
Key breakout level: close above R1/R2 with volume can signal stronger upside.
Key breakdown level: close below S1/S2 increases short-term weakness risk.
🗓 Short-Term Price Range
Given recent volatility, expect intraday swings of ~₹15–₹30 from current levels (based on ATR and recent price range).
🔍 Summary — 1-Day Technical Levels
Level Price Zone Bias
R3 ~ ₹1,020+ Strong resistance area
R2 ~ ₹1,008–₹1,024 Secondary resistance
R1 ~ ₹992–₹1,008 First upside hurdle
Pivot ~ ₹976.5 Key intraday trend marker
S1 ~ ₹964–₹970 First downside support
S2 ~ ₹959–₹960 Secondary support
S3 ~ ₹944–₹952 Stronger support area
📌 Notes for Today
✔ Intraday bias turns bullish only if price sustains above the pivot and breaks R1 on volume.
✔ If price slides below S1/S2, the next cushion is around S3 — failure below that suggests deeper corrective moves.
✔ These levels adjust daily based on price action — use with real-time charts for validation.

Contact Knowledgehub for a detailed consultation: Dm on WhatsApp: [wa.link/a2o0kz]-
Phone No: [+91 93102 26243]-
Email: [tradingviewknowledgehub@gmail.com]---
-- Let’s achieve success together!
Phone No: [+91 93102 26243]-
Email: [tradingviewknowledgehub@gmail.com]---
-- Let’s achieve success together!
관련 발행물
면책사항
해당 정보와 게시물은 금융, 투자, 트레이딩 또는 기타 유형의 조언이나 권장 사항으로 간주되지 않으며, 트레이딩뷰에서 제공하거나 보증하는 것이 아닙니다. 자세한 내용은 이용 약관을 참조하세요.