
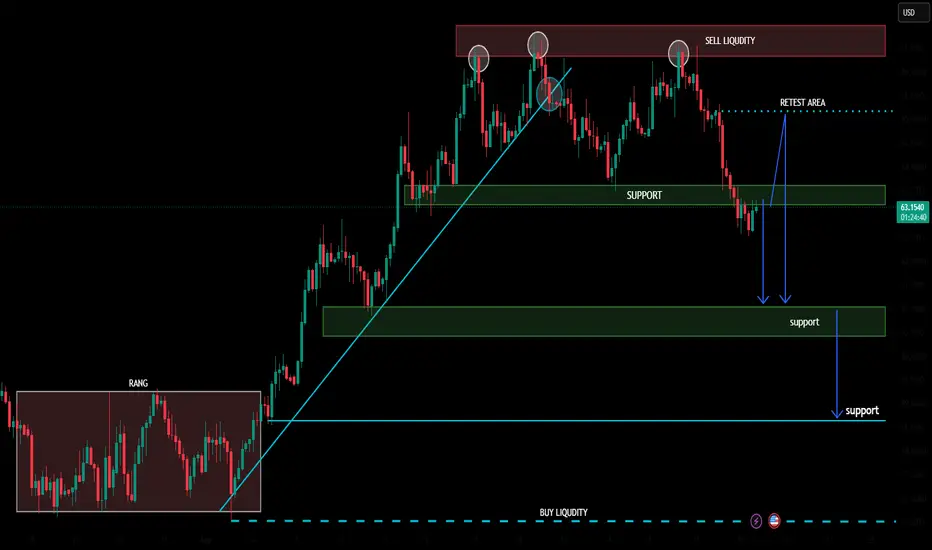
Technical Analysis | Retest & Key Targets 📊
Price is currently around 63.22 and has pulled back into the marked support zone after rejecting the sell-liquidity area near the recent highs.
📌 Resistance / Retest Area
• 65.00–65.20 — key retest zone
• 66.20–66.60 — major resistance / sell-liquidity zone
📌 Support Levels
• S1: 63.00–63.50
• S2: 60.50–61.00
• S3: 58.60–58.80
• Major lower liquidity: ~56.60
🎯 Bullish Targets
If the current support holds and price reclaims 65.00–65.20:
• Target 1: 65.20
• Target 2: 66.20
• Target 3: 66.50–66.60 🎯
📉 Bearish Scenario
If price loses the 63.00–63.50 support zone, the next marked levels become:
• Target 1: 61.00
• Target 2: 60.50
• Target 3: 58.60–58.80 🎯
📊 Technical View
The chart shows a pullback from the upper sell-liquidity zone into support. The 63.00–63.50 area is the key decision zone. A successful hold and reclaim of 65.00–65.20 would favor a move back toward the upper liquidity area, while a confirmed breakdown below support could expose the lower support zones.
⚠️ Risk Management
This is chart-based technical analysis and represents potential scenarios, not guaranteed results or financial advice. Wait for confirmation and manage risk according to your own strategy.
액티브 트레이드
ACTIVE NOW 
관련 발행물
면책사항
해당 정보와 게시물은 금융, 투자, 트레이딩 또는 기타 유형의 조언이나 권장 사항으로 간주되지 않으며, 트레이딩뷰에서 제공하거나 보증하는 것이 아닙니다. 자세한 내용은 이용 약관을 참조하세요.
관련 발행물
면책사항
해당 정보와 게시물은 금융, 투자, 트레이딩 또는 기타 유형의 조언이나 권장 사항으로 간주되지 않으며, 트레이딩뷰에서 제공하거나 보증하는 것이 아닙니다. 자세한 내용은 이용 약관을 참조하세요.