SIPC - EGX : Technical Analysis
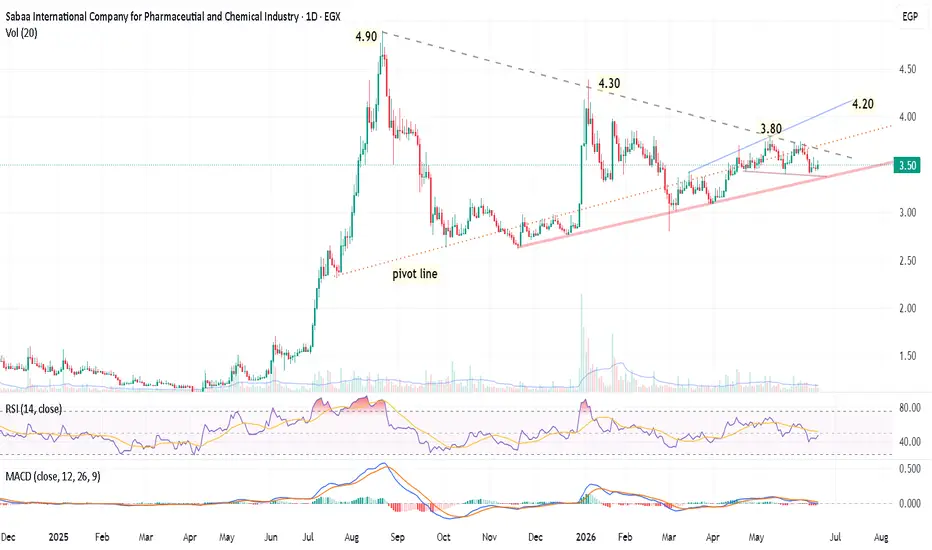
 SIPC Daily Chart
1. Price Action and Key Levels
The Critical Squeeze: The stock is trading inside a massive, multi-month consolidating wedge. It is heavily squeezed between a long-term descending trendline (connecting the 4.90 and 4.30 peaks) and a well-defined ascending support line (labeled as the pivot line).
Current Stand: The closing price of 3.50 EGP sits precisely on the major ascending support line. This is a classic "make or break" pivot area.
Immediate Boundaries:
Resistance: The recent minor peak at 3.80 and the descending trendline (currently intersecting around 3.65–3.70). A secondary ascending target line is plotted toward 4.20.
Support: The current 3.40–3.50 zone. A decisive daily close below this ascending trendline would break the long-term structural support, potentially triggering sharp downside volatility.
2. Momentum Indicators
RSI (14): Sitting at 46.93 (below its yellow signal line at 51.44). This indicates a lack of buying momentum and a slight bearish bias as it hovers just below the neutral 50 line.
MACD (12, 26, 9): Both the MACD line (-0.022) and the signal line (-0.009) are compressed right against the zero baseline, with flat histogram bars. This reflects the intense compression and loss of velocity seen in the price action—the calm before a potential storm.
3. Risk and Volatility Assessment
Historically, this stock exhibits explosive, low-liquidity vertical surges (like the move to 4.90 in mid-2025 and the sudden spike to 4.30 in early 2026) followed by prolonged, harsh distribution phases.
Because the price is tightly coiled at the apex of the triangle, a breakout or breakdown is imminent. Trading at the apex carries high execution risk because whipsaws (fake-outs) are common before a true directional trend establishes itself.
Are you looking to manage an existing exposure at this 3.50 support level, or are you waiting for a confirmed breakout above the 3.80 resistance before considering an entry?
거래청산: 타겟 닿음

면책사항
해당 정보와 게시물은 금융, 투자, 트레이딩 또는 기타 유형의 조언이나 권장 사항으로 간주되지 않으며, 트레이딩뷰에서 제공하거나 보증하는 것이 아닙니다. 자세한 내용은 이용 약관을 참조하세요.
면책사항
해당 정보와 게시물은 금융, 투자, 트레이딩 또는 기타 유형의 조언이나 권장 사항으로 간주되지 않으며, 트레이딩뷰에서 제공하거나 보증하는 것이 아닙니다. 자세한 내용은 이용 약관을 참조하세요.