
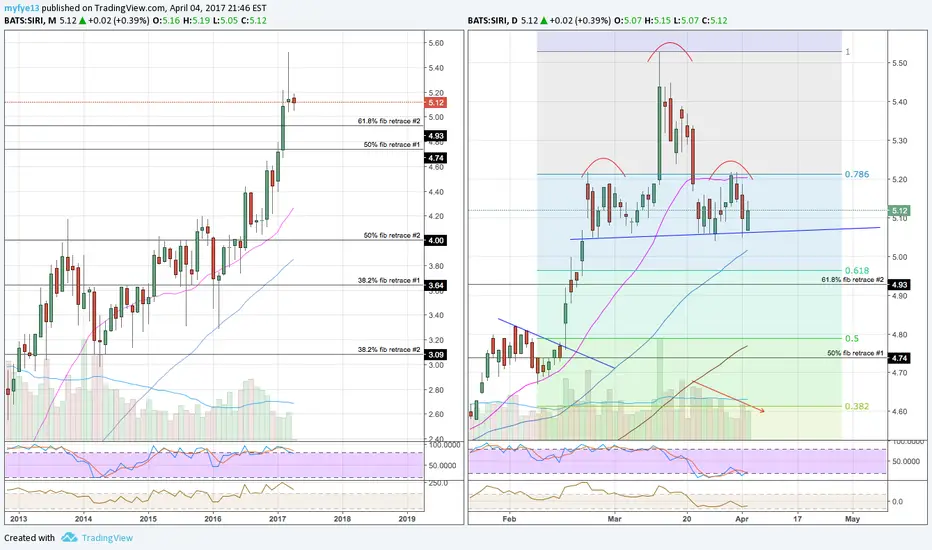
Siri has formed a head and shoulders pattern after a strong uptrend since it was $0.04 in February of 2009.
Some notes:
- Monthly indicators show the stock is well overbought and due for a pullback. Daily indicators show the stock is oversold after pulling back from $5.53 (52 week high). I would look for the stock to consolidate momentum near the neckline prior to pushing through.
- Monthly chart shows 2 fibonacci retracement points that the stock has used as support and resistance and could fall to should the stock break the H&S neckline. Moreover, on the daily chart, from $4.05 the right shoulder has used the 78.6% retrace as resistance, telling me that if the neckline breaks, our first point of resistance may be at $4.96 (61.8% retrace). (Yea, my brain hurts from all these fib numbers too)
- Volume is very telling here. Typically what you want to see in a H&S pattern is higher volume on the left shoulder, and possibly the head, with declining volume on the right shoulder's uptrend. Moreover, you'll notice that after the head formed (and frankly throughout the whole formation), negative days have shown higher volume than positive days.
- Monthly chart also shows a shooting star doji (without the shaved head). However, "technically", a shooting star doji should open lower, so don't read too much into that.
- On 3/22 the stock gapped lower and slowly covering the gap over the next few days before moving lower. No one likes a gap unfilled and this shows the stock is ready to move lower
Some notes:
- Monthly indicators show the stock is well overbought and due for a pullback. Daily indicators show the stock is oversold after pulling back from $5.53 (52 week high). I would look for the stock to consolidate momentum near the neckline prior to pushing through.
- Monthly chart shows 2 fibonacci retracement points that the stock has used as support and resistance and could fall to should the stock break the H&S neckline. Moreover, on the daily chart, from $4.05 the right shoulder has used the 78.6% retrace as resistance, telling me that if the neckline breaks, our first point of resistance may be at $4.96 (61.8% retrace). (Yea, my brain hurts from all these fib numbers too)
- Volume is very telling here. Typically what you want to see in a H&S pattern is higher volume on the left shoulder, and possibly the head, with declining volume on the right shoulder's uptrend. Moreover, you'll notice that after the head formed (and frankly throughout the whole formation), negative days have shown higher volume than positive days.
- Monthly chart also shows a shooting star doji (without the shaved head). However, "technically", a shooting star doji should open lower, so don't read too much into that.
- On 3/22 the stock gapped lower and slowly covering the gap over the next few days before moving lower. No one likes a gap unfilled and this shows the stock is ready to move lower
액티브 트레이드
I think this may be the break we've been waiting for
면책사항
해당 정보와 게시물은 금융, 투자, 트레이딩 또는 기타 유형의 조언이나 권장 사항으로 간주되지 않으며, 트레이딩뷰에서 제공하거나 보증하는 것이 아닙니다. 자세한 내용은 이용 약관을 참조하세요.
면책사항
해당 정보와 게시물은 금융, 투자, 트레이딩 또는 기타 유형의 조언이나 권장 사항으로 간주되지 않으며, 트레이딩뷰에서 제공하거나 보증하는 것이 아닙니다. 자세한 내용은 이용 약관을 참조하세요.