
If you're here it probably means you do just like me.
So here's what I've dug out,
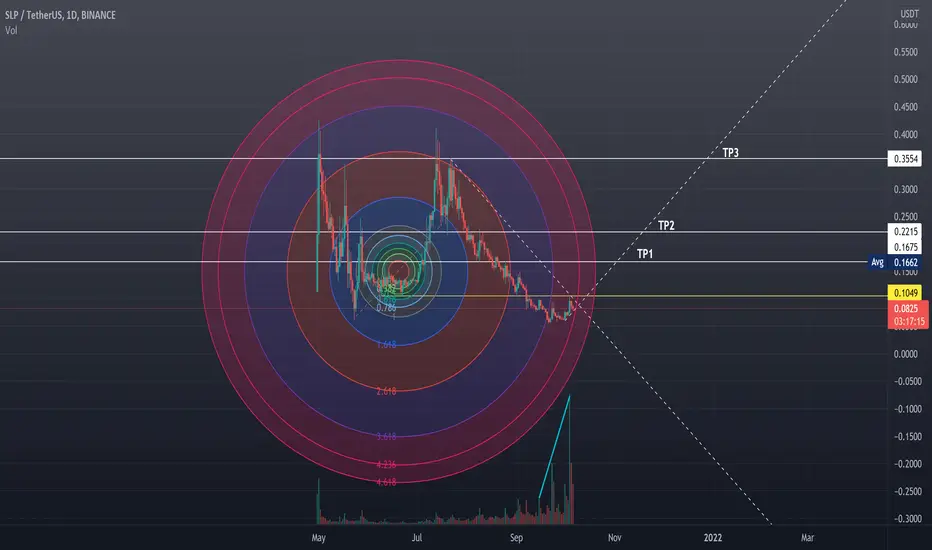
first look at the volume at the bottom of the chart
Second the chart seems to indicate that a REALLY insane pump will take place right around the corner if it successfully holds the current trend for 3-4 days.
thirdly, the chart simply looks like a giga double bottom forming.
and lastly, there's the Fib 4.236 looking primed up for a price increase.
**DYOR** This chart is only one data point and my personal forecast based on what I see, don't make an investment based only on this chart.

면책사항
해당 정보와 게시물은 금융, 투자, 트레이딩 또는 기타 유형의 조언이나 권장 사항으로 간주되지 않으며, 트레이딩뷰에서 제공하거나 보증하는 것이 아닙니다. 자세한 내용은 이용 약관을 참조하세요.
면책사항
해당 정보와 게시물은 금융, 투자, 트레이딩 또는 기타 유형의 조언이나 권장 사항으로 간주되지 않으며, 트레이딩뷰에서 제공하거나 보증하는 것이 아닙니다. 자세한 내용은 이용 약관을 참조하세요.