
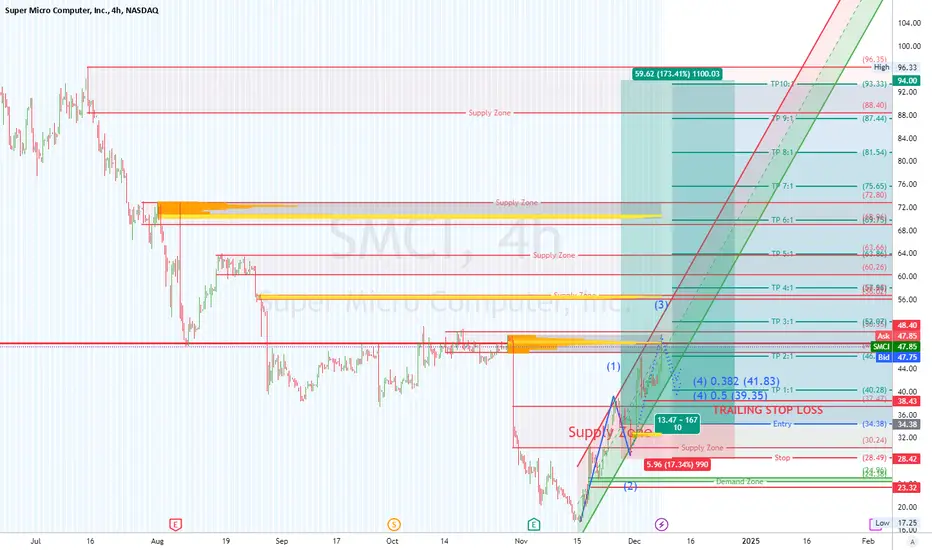
SMCI: Long Setup Analysis (4H Timeframe Update)
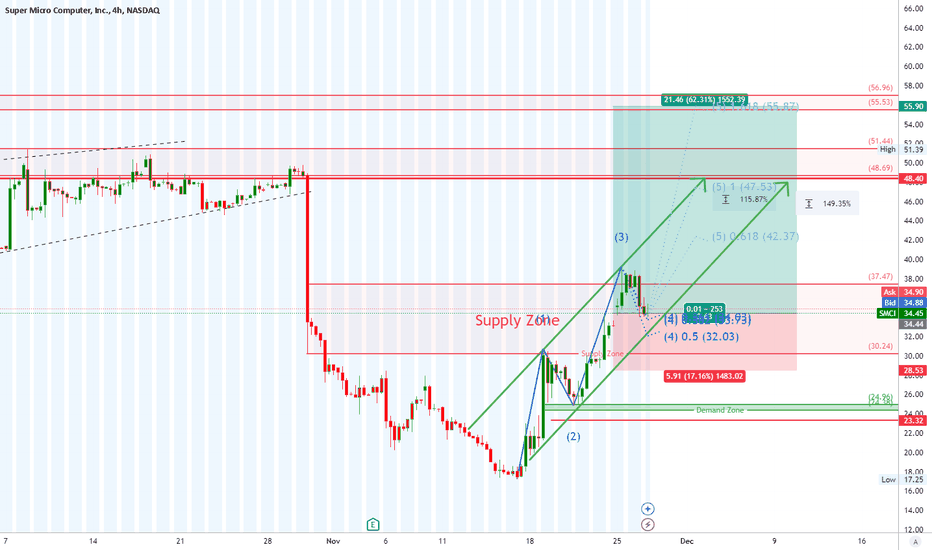
Previous Idea Recap:
The prior long setup on SMCI performed excellently, with the stock rebounding sharply from a prolonged downtrend caused by adverse news. The price is now in a strong recovery phase, breaking key resistance levels and surging higher.
Supply and Demand Zones (Updated):
- Supply Zones (Resistance):
- $48.40–$50.35: The current price is testing this zone, which aligns with the 0.618–0.786 Fibonacci retracement levels. Expect possible resistance or consolidation here.
- $55.24–$59.68: The next major supply zone, aligning with the 0.786 Fibonacci retracement level and the likely completion of Wave 5.
- $68.90–$72.50: Higher timeframe resistance zone. If the bullish breakout sustains, this is the long-term target zone.
- $88.40–$96.35: is the ultimate highest SZ up with a potential RRR of 10:1
Plan of Action:
- If Holding Positions: Trail your stop below recent swing lows to secure profits while allowing the trade to run.
- For New Positions: Wait for either a confirmed breakout above $50.35 or a retracement into the $38.90–$41.00 demand zone for the best entry.
"Trade what you see, not what you hope."
Disclaimer:
This analysis is for educational purposes only and should not be considered financial advice. Trading involves significant risk, and you should only trade with capital you can afford to lose. Always perform your own analysis and risk management.

By Dubai Traders Hub
Follow us on X , YouTube, and Join our Telegram Channel
Follow us on X , YouTube, and Join our Telegram Channel
관련 발행물
면책사항
해당 정보와 게시물은 금융, 투자, 트레이딩 또는 기타 유형의 조언이나 권장 사항으로 간주되지 않으며, 트레이딩뷰에서 제공하거나 보증하는 것이 아닙니다. 자세한 내용은 이용 약관을 참조하세요.
By Dubai Traders Hub
Follow us on X , YouTube, and Join our Telegram Channel
Follow us on X , YouTube, and Join our Telegram Channel
관련 발행물
면책사항
해당 정보와 게시물은 금융, 투자, 트레이딩 또는 기타 유형의 조언이나 권장 사항으로 간주되지 않으며, 트레이딩뷰에서 제공하거나 보증하는 것이 아닙니다. 자세한 내용은 이용 약관을 참조하세요.