
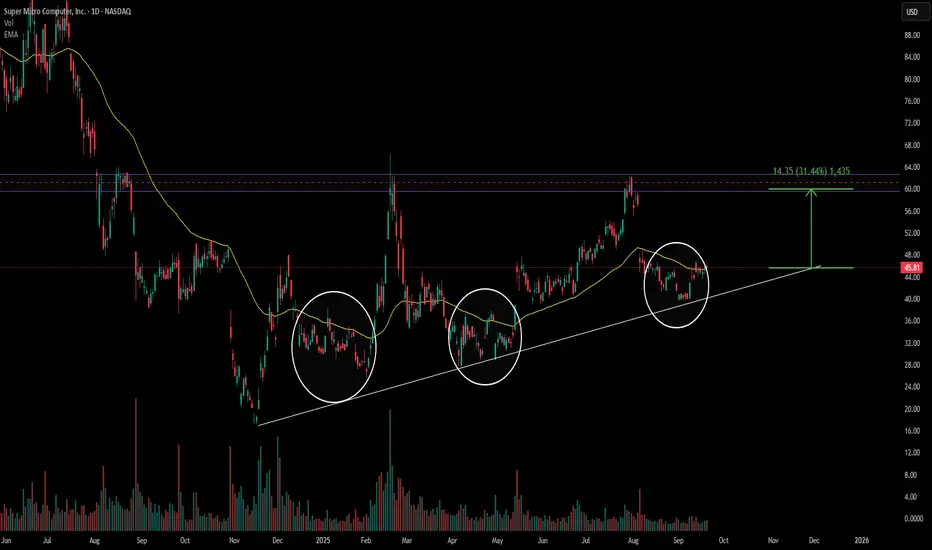
Every time price makes a fake breakdown below the 50 EMA, it quickly recovers and pushes higher.
Historically, these moves have led price to test the purple resistance zone highlighted on the chart.
Given the repeated pattern, I think the same dynamic could play out again, with price eventually making its way back to that resistance area.
🎯 Conclusion: Based on prior reactions to the 50 EMA, I expect SMCI to work its way toward the purple resistance zone. This is my professional view from the chart structure, though markets remain uncertain and no outcome is guaranteed.
👉 Stay tuned for more structured market insights — follow along for consistent expert-level analysis.

면책사항
해당 정보와 게시물은 금융, 투자, 트레이딩 또는 기타 유형의 조언이나 권장 사항으로 간주되지 않으며, 트레이딩뷰에서 제공하거나 보증하는 것이 아닙니다. 자세한 내용은 이용 약관을 참조하세요.
면책사항
해당 정보와 게시물은 금융, 투자, 트레이딩 또는 기타 유형의 조언이나 권장 사항으로 간주되지 않으며, 트레이딩뷰에서 제공하거나 보증하는 것이 아닙니다. 자세한 내용은 이용 약관을 참조하세요.