
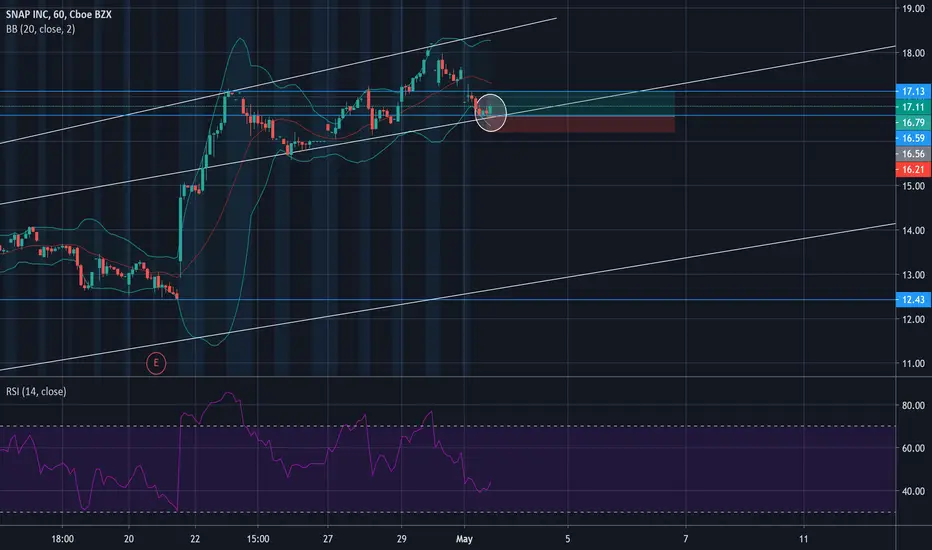
This one is tricky.
1) There is a big engulfing candlestick, which suggests that there will be an up movement, you could take this long position and make your profit just on the above resistance ($17.13).
2) wait to see what happens when it reaches that resistance ($17.13) :
if it fails to break out, there is will be ahead and shoulder pattern suggesting a change in momentum, you can short it then.
3) Bollinger band are suggesting a move upward
1) There is a big engulfing candlestick, which suggests that there will be an up movement, you could take this long position and make your profit just on the above resistance ($17.13).
2) wait to see what happens when it reaches that resistance ($17.13) :
if it fails to break out, there is will be ahead and shoulder pattern suggesting a change in momentum, you can short it then.
3) Bollinger band are suggesting a move upward
거래청산: 타겟 닿음
I'm closing this since it reached $17.16 today what I had expected ($17.13)
면책사항
해당 정보와 게시물은 금융, 투자, 트레이딩 또는 기타 유형의 조언이나 권장 사항으로 간주되지 않으며, 트레이딩뷰에서 제공하거나 보증하는 것이 아닙니다. 자세한 내용은 이용 약관을 참조하세요.
면책사항
해당 정보와 게시물은 금융, 투자, 트레이딩 또는 기타 유형의 조언이나 권장 사항으로 간주되지 않으며, 트레이딩뷰에서 제공하거나 보증하는 것이 아닙니다. 자세한 내용은 이용 약관을 참조하세요.