Long
Steinhoff - still long
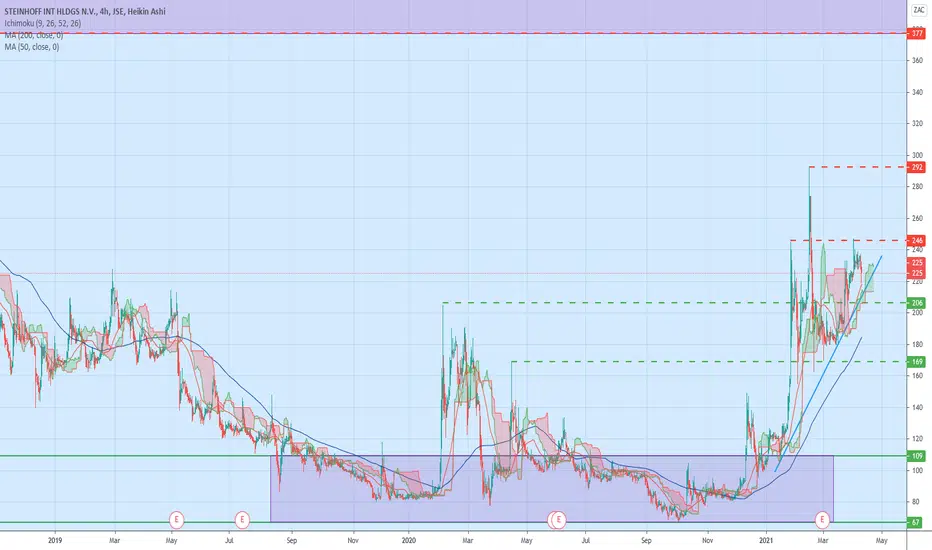
This is an update of the chart posted on Feb 20, 2021. Price has risen 20% since the last post. Today the price fell to 220, which is just above the 50 MA, and bounced up to the close of 225. The lover trend line (blue) was not broken. Ichimoku is green and wide. The MAs are running parallel and up. These visual indicators confirm bullish sentiment. Near-term resistance and support levels shown in dashed lines. Please follow BradtNom, leave a comment or link to your own ideas! Charts are for information purposes only. Not trade suggestions. DYOR (Do your own research) - act responsibly with your money.

면책사항
해당 정보와 게시물은 금융, 투자, 트레이딩 또는 기타 유형의 조언이나 권장 사항으로 간주되지 않으며, 트레이딩뷰에서 제공하거나 보증하는 것이 아닙니다. 자세한 내용은 이용 약관을 참조하세요.
면책사항
해당 정보와 게시물은 금융, 투자, 트레이딩 또는 기타 유형의 조언이나 권장 사항으로 간주되지 않으며, 트레이딩뷰에서 제공하거나 보증하는 것이 아닙니다. 자세한 내용은 이용 약관을 참조하세요.