
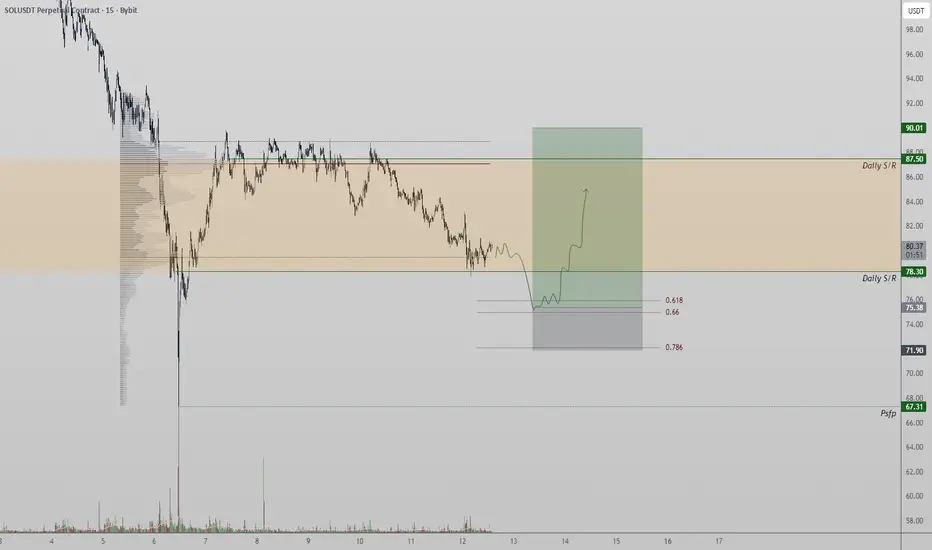
Solana price action is currently bouncing from daily support near the $71 level, an area that aligns closely with the value area low, adding technical significance to the zone. This region has acted as a short-term demand area, allowing price to stabilize after recent downside pressure. However, the rebound so far has lacked strong bullish influxes, suggesting that buyer conviction remains limited.
From a Fibonacci perspective, the lower 0.618 retracement has not yet been tested. In many corrective structures, price often sweeps nearby liquidity before establishing a sustainable bottom. This means Solana could briefly rotate lower to test the 0.618 Fibonacci level, potentially taking out early long positions, before attempting a more meaningful reversal.
Such a move would be consistent with a bottoming process rather than immediate continuation. If price finds acceptance and strong demand at the Fibonacci support, it would increase the probability of a rotational move higher. In that scenario, the next key upside target would be the higher-timeframe resistance near $87.50.
From a technical and price action perspective, Solana is currently trading in a key reversal zone. A successful bottoming structure, supported by improving volume, would be required to confirm a shift in momentum and open the door for upside continuation. Until then, traders should remain cautious and monitor liquidity behavior closely.
From a Fibonacci perspective, the lower 0.618 retracement has not yet been tested. In many corrective structures, price often sweeps nearby liquidity before establishing a sustainable bottom. This means Solana could briefly rotate lower to test the 0.618 Fibonacci level, potentially taking out early long positions, before attempting a more meaningful reversal.
Such a move would be consistent with a bottoming process rather than immediate continuation. If price finds acceptance and strong demand at the Fibonacci support, it would increase the probability of a rotational move higher. In that scenario, the next key upside target would be the higher-timeframe resistance near $87.50.
From a technical and price action perspective, Solana is currently trading in a key reversal zone. A successful bottoming structure, supported by improving volume, would be required to confirm a shift in momentum and open the door for upside continuation. Until then, traders should remain cautious and monitor liquidity behavior closely.

Join the Free Trading Group
Telegram: t.me/freetradingden 🔥
Claim $1000 Deposit Bonus 🎁
Trade with perks & support the community!
partner.blofin.com/d/TheAlchemist
Stay sharp, trade smart.
— Team The Alchemist ⚔️
Telegram: t.me/freetradingden 🔥
Claim $1000 Deposit Bonus 🎁
Trade with perks & support the community!
partner.blofin.com/d/TheAlchemist
Stay sharp, trade smart.
— Team The Alchemist ⚔️
면책사항
해당 정보와 게시물은 금융, 투자, 트레이딩 또는 기타 유형의 조언이나 권장 사항으로 간주되지 않으며, 트레이딩뷰에서 제공하거나 보증하는 것이 아닙니다. 자세한 내용은 이용 약관을 참조하세요.
Join the Free Trading Group
Telegram: t.me/freetradingden 🔥
Claim $1000 Deposit Bonus 🎁
Trade with perks & support the community!
partner.blofin.com/d/TheAlchemist
Stay sharp, trade smart.
— Team The Alchemist ⚔️
Telegram: t.me/freetradingden 🔥
Claim $1000 Deposit Bonus 🎁
Trade with perks & support the community!
partner.blofin.com/d/TheAlchemist
Stay sharp, trade smart.
— Team The Alchemist ⚔️
면책사항
해당 정보와 게시물은 금융, 투자, 트레이딩 또는 기타 유형의 조언이나 권장 사항으로 간주되지 않으며, 트레이딩뷰에서 제공하거나 보증하는 것이 아닙니다. 자세한 내용은 이용 약관을 참조하세요.