
🔍 Overall Market Structure
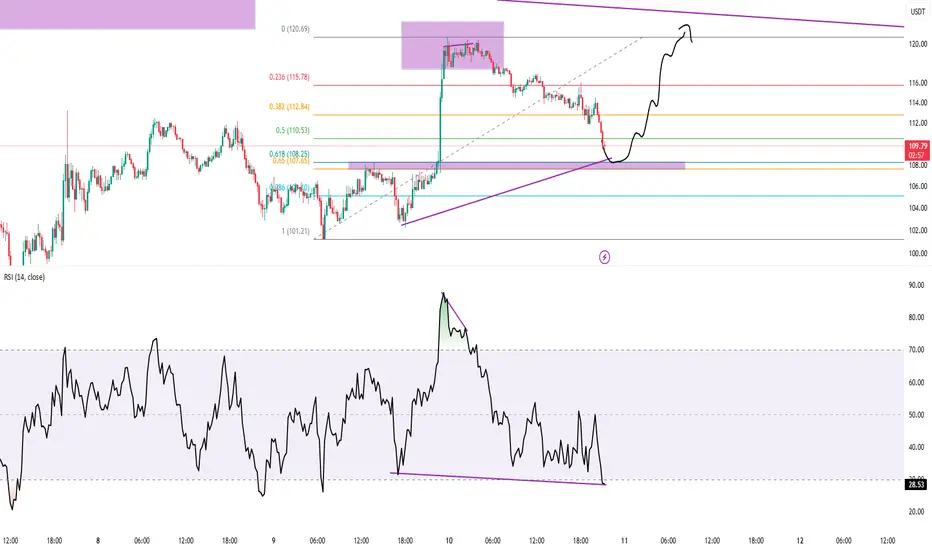
The price recently saw a sharp drop from the $120.69 high and is currently consolidating around the $108–110 area.
A bullish structure is forming, suggested by the potential for a reversal pattern from a support zone.
🧠 Key Technical Components
📉 Fibonacci Levels (retracement from $101.21 to $120.69):
0.236 – $115.78 (resistance)
0.382 – $112.84
0.5 – $110.53
0.618 – $108.25 ← Current support
0.786 – $105.20
Price is bouncing from the 0.618 zone, a strong reversal area.
🟣 RSI (Relative Strength Index):
RSI is near oversold (31.15) and showing bullish divergence:
Price made lower lows.
RSI made higher lows.
This divergence suggests momentum is weakening on the downside, signaling a potential bullish reversal.
🟪 Support & Resistance Zones:
Demand Zone (support) around $107–108 (marked with purple box).
Supply Zone (resistance) around $118–120.
Price could bounce from support, targeting higher fib levels and possibly retesting the supply zone.
✏️ Projected Price Action (Black Curve):
Anticipated short-term reversal from $108.
Price might climb through:
$110 (0.5 fib)
$112.84 (0.382 fib)
Potentially to $115.78 (0.236 fib) or even back to the $120.69 high.
Shown within a larger wedge structure, so upper trendline resistance around $120.
✅ Conclusion:
Bullish reversal likely from $107–108 support.
RSI divergence + Fibonacci confluence supports the reversal thesis.
Next targets: $110.50 → $112.84 → $115.78 with final resistance near $120.69.
The price recently saw a sharp drop from the $120.69 high and is currently consolidating around the $108–110 area.
A bullish structure is forming, suggested by the potential for a reversal pattern from a support zone.
🧠 Key Technical Components
📉 Fibonacci Levels (retracement from $101.21 to $120.69):
0.236 – $115.78 (resistance)
0.382 – $112.84
0.5 – $110.53
0.618 – $108.25 ← Current support
0.786 – $105.20
Price is bouncing from the 0.618 zone, a strong reversal area.
🟣 RSI (Relative Strength Index):
RSI is near oversold (31.15) and showing bullish divergence:
Price made lower lows.
RSI made higher lows.
This divergence suggests momentum is weakening on the downside, signaling a potential bullish reversal.
🟪 Support & Resistance Zones:
Demand Zone (support) around $107–108 (marked with purple box).
Supply Zone (resistance) around $118–120.
Price could bounce from support, targeting higher fib levels and possibly retesting the supply zone.
✏️ Projected Price Action (Black Curve):
Anticipated short-term reversal from $108.
Price might climb through:
$110 (0.5 fib)
$112.84 (0.382 fib)
Potentially to $115.78 (0.236 fib) or even back to the $120.69 high.
Shown within a larger wedge structure, so upper trendline resistance around $120.
✅ Conclusion:
Bullish reversal likely from $107–108 support.
RSI divergence + Fibonacci confluence supports the reversal thesis.
Next targets: $110.50 → $112.84 → $115.78 with final resistance near $120.69.

면책사항
해당 정보와 게시물은 금융, 투자, 트레이딩 또는 기타 유형의 조언이나 권장 사항으로 간주되지 않으며, 트레이딩뷰에서 제공하거나 보증하는 것이 아닙니다. 자세한 내용은 이용 약관을 참조하세요.
면책사항
해당 정보와 게시물은 금융, 투자, 트레이딩 또는 기타 유형의 조언이나 권장 사항으로 간주되지 않으며, 트레이딩뷰에서 제공하거나 보증하는 것이 아닙니다. 자세한 내용은 이용 약관을 참조하세요.