
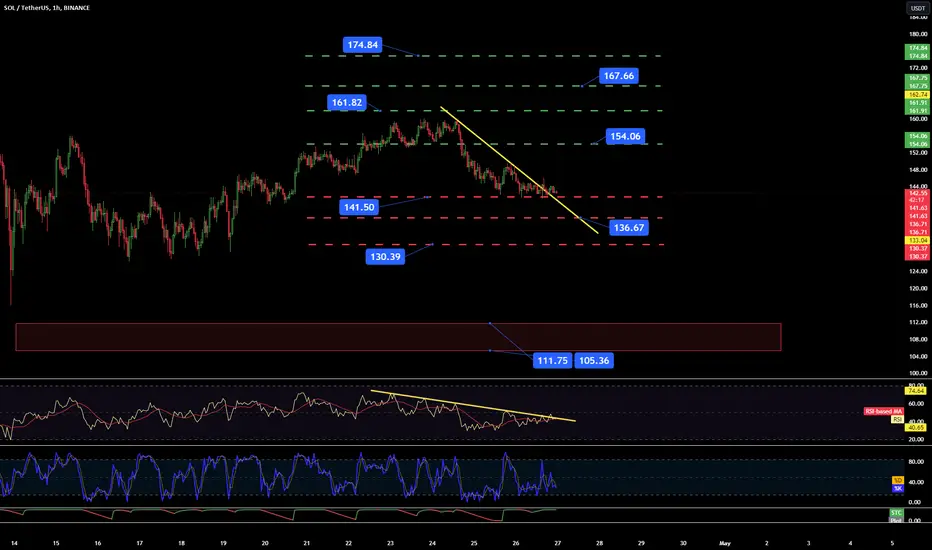
Hello everyone, let's look at the 1H SOL to USDT chart, as we can see the price has entered a sideways movement and is breaking sideways from the local downtrend line.
Let's start by setting goals for the near future that we can include:
T1 = $154
T2 = $162
T3 = $168
AND
T4 = $175
Now let's move on to the stop-loss in case of further market declines:
SL1 = $142
SL2 = $137
SL3 = $130
AND
SL4 = $112 - $105
When we look at the RSI indicator, we will see that we are bouncing off the downward trend line, but we can see that the lateral price movement results in an increase in the indicator, which may again translate into an attempt to drop the price.
Let's start by setting goals for the near future that we can include:
T1 = $154
T2 = $162
T3 = $168
AND
T4 = $175
Now let's move on to the stop-loss in case of further market declines:
SL1 = $142
SL2 = $137
SL3 = $130
AND
SL4 = $112 - $105
When we look at the RSI indicator, we will see that we are bouncing off the downward trend line, but we can see that the lateral price movement results in an increase in the indicator, which may again translate into an attempt to drop the price.

면책사항
해당 정보와 게시물은 금융, 투자, 트레이딩 또는 기타 유형의 조언이나 권장 사항으로 간주되지 않으며, 트레이딩뷰에서 제공하거나 보증하는 것이 아닙니다. 자세한 내용은 이용 약관을 참조하세요.
면책사항
해당 정보와 게시물은 금융, 투자, 트레이딩 또는 기타 유형의 조언이나 권장 사항으로 간주되지 않으며, 트레이딩뷰에서 제공하거나 보증하는 것이 아닙니다. 자세한 내용은 이용 약관을 참조하세요.