
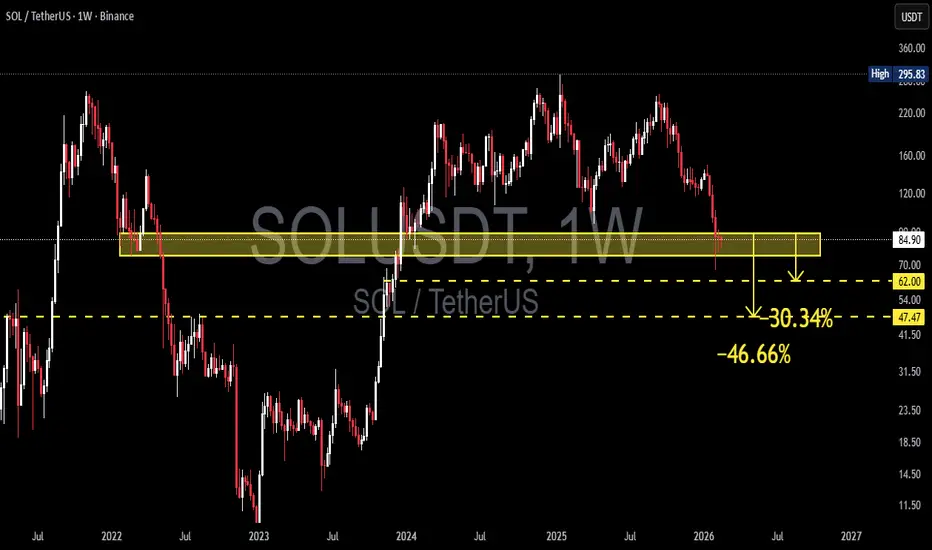
On the 1W (Weekly) timeframe, SOLUSDT is currently testing a key zone that previously acted as strong support and has now turned into a critical resistance area at 89 – 75 USDT (yellow block).
This zone represents:
A strong demand area in 2022
A major accumulation base before the 2024 rally
A horizontal support that has flipped into resistance (S/R Flip)
Price is currently trading just below this area after a sharp decline from the 2025 swing high.
---
Structure & Pattern Formation
From a market structure perspective:
A Lower High has formed after failing to sustain above the 160–200 region
Breakdown from mid-range structure
Retest of weekly supply (89–75 zone)
This suggests:
Distribution / Bearish Rejection Zone
The 89–75 area acts as:
A historical distribution base
A multi-year supply zone
Strong horizontal resistance
If price fails to reclaim this zone, this move could be interpreted as a breakdown retest before the next bearish leg.
---
Key Levels
Resistance:
89 – 75 (Critical Weekly Supply Zone)
100 – 110 (Next resistance if breakout occurs)
Support:
62 USDT (≈ -30% downside projection)
47 USDT (≈ -46% downside projection)
40–50 zone (Historical 2023 demand area)
Downside projections shown on the chart:
From 89 → 62 = -30.34%
From 89 → 47 = -46.66%
---
Bullish Scenario
Bullish confirmation requires:
1. A strong weekly close above 89
2. Reclaiming the 89–75 zone as support
3. Formation of a Higher Low above 75
If confirmed, upside targets:
110
140
160
Potential revisit of 200+ in the next expansion cycle
A valid bullish continuation would require strong weekly momentum and significant volume.
---
Bearish Scenario (Currently More Dominant)
If price fails to break and close above 89 and shows rejection:
Downside targets:
1. 62 USDT (-30%)
2. 47 USDT (-46%)
3. Possible liquidity sweep into the 40 zone if broader market weakens
This would confirm the 89–75 zone as a strong multi-year resistance.
As long as price remains below 89, the structure leans bearish.
---
Conclusion
The 89 – 75 zone is the major decision point for SOL.
As long as price trades below this zone, the risk of a correction toward 62 and even 47 remains open.
A breakout and reclaim above this area would shift the bias back to bullish.
Weekly close confirmation is key.
The market is currently at a high-impact decision level.
#SOLUSDT #SOLAnalysis #CryptoAnalysis #TechnicalAnalysis #PriceAction #Altcoin #CryptoTrading #WeeklyChart #SupportResistance #CryptoMarket
This zone represents:
A strong demand area in 2022
A major accumulation base before the 2024 rally
A horizontal support that has flipped into resistance (S/R Flip)
Price is currently trading just below this area after a sharp decline from the 2025 swing high.
---
Structure & Pattern Formation
From a market structure perspective:
A Lower High has formed after failing to sustain above the 160–200 region
Breakdown from mid-range structure
Retest of weekly supply (89–75 zone)
This suggests:
Distribution / Bearish Rejection Zone
The 89–75 area acts as:
A historical distribution base
A multi-year supply zone
Strong horizontal resistance
If price fails to reclaim this zone, this move could be interpreted as a breakdown retest before the next bearish leg.
---
Key Levels
Resistance:
89 – 75 (Critical Weekly Supply Zone)
100 – 110 (Next resistance if breakout occurs)
Support:
62 USDT (≈ -30% downside projection)
47 USDT (≈ -46% downside projection)
40–50 zone (Historical 2023 demand area)
Downside projections shown on the chart:
From 89 → 62 = -30.34%
From 89 → 47 = -46.66%
---
Bullish Scenario
Bullish confirmation requires:
1. A strong weekly close above 89
2. Reclaiming the 89–75 zone as support
3. Formation of a Higher Low above 75
If confirmed, upside targets:
110
140
160
Potential revisit of 200+ in the next expansion cycle
A valid bullish continuation would require strong weekly momentum and significant volume.
---
Bearish Scenario (Currently More Dominant)
If price fails to break and close above 89 and shows rejection:
Downside targets:
1. 62 USDT (-30%)
2. 47 USDT (-46%)
3. Possible liquidity sweep into the 40 zone if broader market weakens
This would confirm the 89–75 zone as a strong multi-year resistance.
As long as price remains below 89, the structure leans bearish.
---
Conclusion
The 89 – 75 zone is the major decision point for SOL.
As long as price trades below this zone, the risk of a correction toward 62 and even 47 remains open.
A breakout and reclaim above this area would shift the bias back to bullish.
Weekly close confirmation is key.
The market is currently at a high-impact decision level.
#SOLUSDT #SOLAnalysis #CryptoAnalysis #TechnicalAnalysis #PriceAction #Altcoin #CryptoTrading #WeeklyChart #SupportResistance #CryptoMarket

✅ Get Free Signals! Join Our Telegram Channel Here: t.me/TheCryptoNuclear
✅ Twitter: twitter.com/crypto_nuclear
✅ Join Bybit : partner.bybit.com/b/nuclearvip
✅ Benefits : Lifetime Trading Fee Discount -50%
✅ Twitter: twitter.com/crypto_nuclear
✅ Join Bybit : partner.bybit.com/b/nuclearvip
✅ Benefits : Lifetime Trading Fee Discount -50%
면책사항
해당 정보와 게시물은 금융, 투자, 트레이딩 또는 기타 유형의 조언이나 권장 사항으로 간주되지 않으며, 트레이딩뷰에서 제공하거나 보증하는 것이 아닙니다. 자세한 내용은 이용 약관을 참조하세요.
✅ Get Free Signals! Join Our Telegram Channel Here: t.me/TheCryptoNuclear
✅ Twitter: twitter.com/crypto_nuclear
✅ Join Bybit : partner.bybit.com/b/nuclearvip
✅ Benefits : Lifetime Trading Fee Discount -50%
✅ Twitter: twitter.com/crypto_nuclear
✅ Join Bybit : partner.bybit.com/b/nuclearvip
✅ Benefits : Lifetime Trading Fee Discount -50%
면책사항
해당 정보와 게시물은 금융, 투자, 트레이딩 또는 기타 유형의 조언이나 권장 사항으로 간주되지 않으며, 트레이딩뷰에서 제공하거나 보증하는 것이 아닙니다. 자세한 내용은 이용 약관을 참조하세요.