
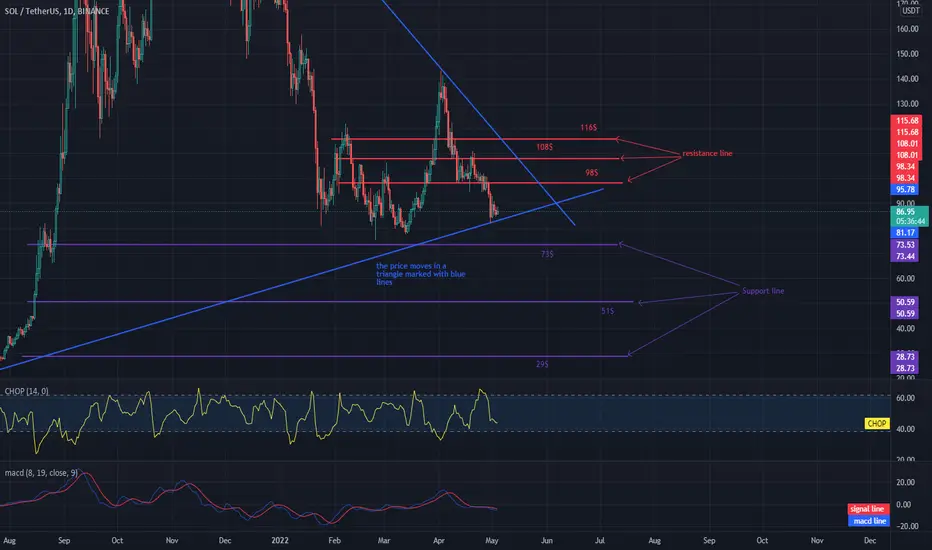
Hello everyone, let's take a look at the SOL to USDT chart in 1 day. As you can see, the price moves in the triangle marked by the blue lines.
Let's start with the designation of the support line and as you can see the first support in the near future is $ 73, if the support falls, the next one is $ 51 and $ 29.
Now let's move from the resistance line as you can see the first resistance is $ 98, if you can break it the next resistance will be $ 108 and $ 116.
Looking at the CHOP indicator, we can see that in the 1-day range we have less and less energy, while the MACD indicator shows that the blue line is just below the red one. Only when the blue line crosses the red line from below will we get confirmation of the upward trend change.
Let's start with the designation of the support line and as you can see the first support in the near future is $ 73, if the support falls, the next one is $ 51 and $ 29.
Now let's move from the resistance line as you can see the first resistance is $ 98, if you can break it the next resistance will be $ 108 and $ 116.
Looking at the CHOP indicator, we can see that in the 1-day range we have less and less energy, while the MACD indicator shows that the blue line is just below the red one. Only when the blue line crosses the red line from below will we get confirmation of the upward trend change.

면책사항
해당 정보와 게시물은 금융, 투자, 트레이딩 또는 기타 유형의 조언이나 권장 사항으로 간주되지 않으며, 트레이딩뷰에서 제공하거나 보증하는 것이 아닙니다. 자세한 내용은 이용 약관을 참조하세요.
면책사항
해당 정보와 게시물은 금융, 투자, 트레이딩 또는 기타 유형의 조언이나 권장 사항으로 간주되지 않으며, 트레이딩뷰에서 제공하거나 보증하는 것이 아닙니다. 자세한 내용은 이용 약관을 참조하세요.