
Hi Folks,
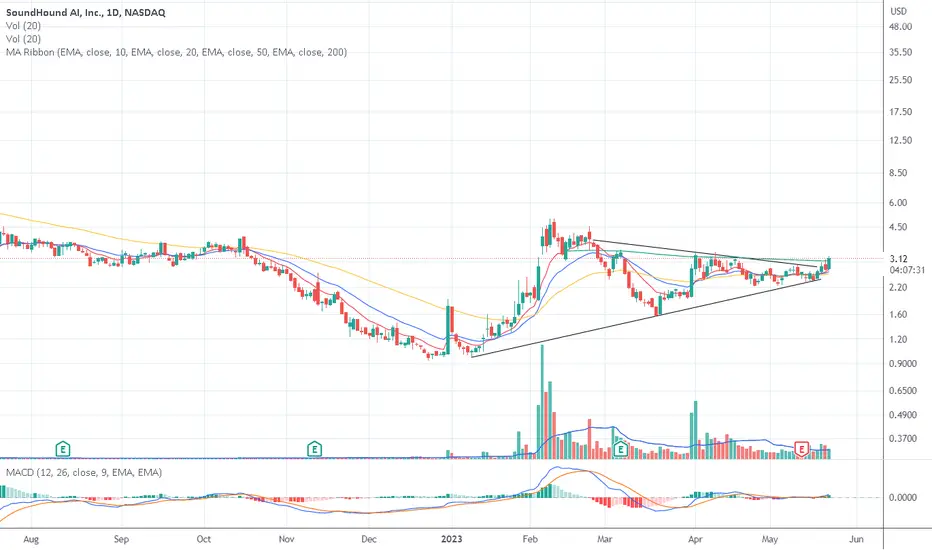
SOUNDHOUND SOUN presents a quite interesting chart pattern.
• A big move in the past 1-3 months anywhere from 30%-100% the rally last for a few days to weeks.
• Stock is above ema 200
• Orderly consolidation with higher lows & tightening range:
• RDM, VCP
• Stocks surfs the rising EMA 10 or the EMA 20, and sometimes the EMA 50
• Volumes are significative compared to previous phase
• Volumes dry up at the end of the consolidation
• Volumes are strong during the breakout
• ADR is high
Does it also "Sounds" good to you ?
SOUNDHOUND SOUN presents a quite interesting chart pattern.
• A big move in the past 1-3 months anywhere from 30%-100% the rally last for a few days to weeks.
• Stock is above ema 200
• Orderly consolidation with higher lows & tightening range:
• RDM, VCP
• Stocks surfs the rising EMA 10 or the EMA 20, and sometimes the EMA 50
• Volumes are significative compared to previous phase
• Volumes dry up at the end of the consolidation
• Volumes are strong during the breakout
• ADR is high
Does it also "Sounds" good to you ?

면책사항
해당 정보와 게시물은 금융, 투자, 트레이딩 또는 기타 유형의 조언이나 권장 사항으로 간주되지 않으며, 트레이딩뷰에서 제공하거나 보증하는 것이 아닙니다. 자세한 내용은 이용 약관을 참조하세요.
면책사항
해당 정보와 게시물은 금융, 투자, 트레이딩 또는 기타 유형의 조언이나 권장 사항으로 간주되지 않으며, 트레이딩뷰에서 제공하거나 보증하는 것이 아닙니다. 자세한 내용은 이용 약관을 참조하세요.