
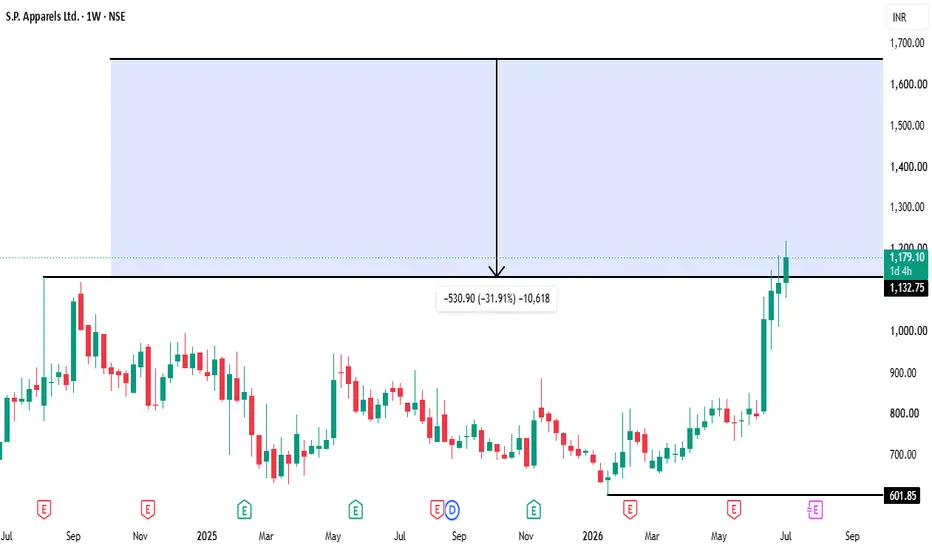
📈 S.P. Apparels Ltd. (1W) – Breakout or Beginning of a Bigger Trend? 🚀
After spending nearly two years in consolidation and correction, S.P. Apparels has finally delivered a strong bullish breakout with exceptional momentum. 💥
🔹 Key Observations:
✅ Price has broken above the long-standing resistance around ₹1,130, a level that previously acted as a major supply zone.
📊 The breakout is supported by large bullish weekly candles, indicating aggressive institutional buying.
📈 Higher highs and higher lows are now visible, confirming a shift in the long-term trend.
🎯 The measured move projection from the base suggests a potential upside towards the ₹1,650–₹1,700 zone if momentum continues.
⚠️ What to Watch Next:
A successful retest of ₹1,130 as support would strengthen the bullish case.
Sustaining above the breakout level is crucial. A failure to hold could result in a temporary pullback before the next move.
Momentum traders may look for continuation patterns instead of chasing extended candles.
💡 Trading Plan:
📌 Resistance turned support: ₹1,130
📌 Bullish above: ₹1,130
📌 Potential Target Zone: ₹1,650–₹1,700
📌 Risk management remains essential—avoid FOMO and wait for confirmation if entering fresh positions.
Overall, the chart has transitioned from a prolonged accumulation phase into a potential long-term expansion phase. The coming weeks will reveal whether this breakout develops into a sustained uptrend. 📈🔥
What are your thoughts? Is this the start of a new bullish cycle or just a breakout rally? Share your view below! 👇
After spending nearly two years in consolidation and correction, S.P. Apparels has finally delivered a strong bullish breakout with exceptional momentum. 💥
🔹 Key Observations:
✅ Price has broken above the long-standing resistance around ₹1,130, a level that previously acted as a major supply zone.
📊 The breakout is supported by large bullish weekly candles, indicating aggressive institutional buying.
📈 Higher highs and higher lows are now visible, confirming a shift in the long-term trend.
🎯 The measured move projection from the base suggests a potential upside towards the ₹1,650–₹1,700 zone if momentum continues.
⚠️ What to Watch Next:
A successful retest of ₹1,130 as support would strengthen the bullish case.
Sustaining above the breakout level is crucial. A failure to hold could result in a temporary pullback before the next move.
Momentum traders may look for continuation patterns instead of chasing extended candles.
💡 Trading Plan:
📌 Resistance turned support: ₹1,130
📌 Bullish above: ₹1,130
📌 Potential Target Zone: ₹1,650–₹1,700
📌 Risk management remains essential—avoid FOMO and wait for confirmation if entering fresh positions.
Overall, the chart has transitioned from a prolonged accumulation phase into a potential long-term expansion phase. The coming weeks will reveal whether this breakout develops into a sustained uptrend. 📈🔥
What are your thoughts? Is this the start of a new bullish cycle or just a breakout rally? Share your view below! 👇

면책사항
해당 정보와 게시물은 금융, 투자, 트레이딩 또는 기타 유형의 조언이나 권장 사항으로 간주되지 않으며, 트레이딩뷰에서 제공하거나 보증하는 것이 아닙니다. 자세한 내용은 이용 약관을 참조하세요.
면책사항
해당 정보와 게시물은 금융, 투자, 트레이딩 또는 기타 유형의 조언이나 권장 사항으로 간주되지 않으며, 트레이딩뷰에서 제공하거나 보증하는 것이 아닙니다. 자세한 내용은 이용 약관을 참조하세요.