
📊 SPARC |
Monthly Chart Analysis
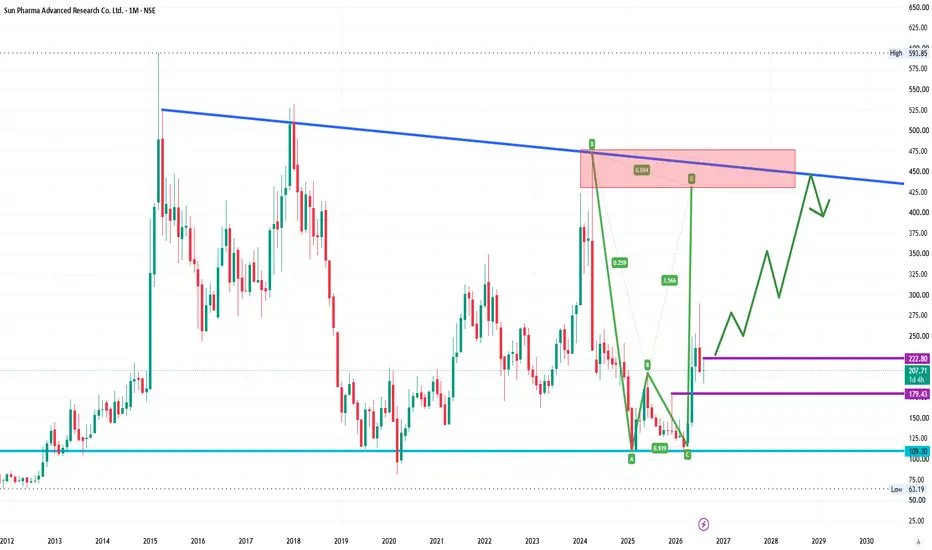
A Potential Bearish Harmonic X-A-B-C-D pattern is developing on the monthly chart.
🔥 Strong Resistance / PRZ: ₹430–₹475
📉 Major Trendline Resistance: ~₹450
🟢 Bullish Scenario
Above ₹225 on a strong monthly close:
🎯 ₹300 → ₹350 → ₹400+
🔴 Bearish Scenario
Rejection from ₹180–₹170 + breakdown:
🎯 ₹140 → ₹100
📌 Current Price: ~₹208
📌 Major Support: ₹100–₹110
📌 Key Decision Zone: ₹430–₹475
The ₹430–₹475 zone is the BIG level to watch.
⚠️ Pattern confirmation is required before taking any trade.
⚠️ Technical analysis only. Not a buy/sell recommendation.
#SPARC #HarmonicPattern #TechnicalAnalysis #NSE #StockMarket #SwingTrading #PriceAction
Monthly Chart Analysis
A Potential Bearish Harmonic X-A-B-C-D pattern is developing on the monthly chart.
🔥 Strong Resistance / PRZ: ₹430–₹475
📉 Major Trendline Resistance: ~₹450
🟢 Bullish Scenario
Above ₹225 on a strong monthly close:
🎯 ₹300 → ₹350 → ₹400+
🔴 Bearish Scenario
Rejection from ₹180–₹170 + breakdown:
🎯 ₹140 → ₹100
📌 Current Price: ~₹208
📌 Major Support: ₹100–₹110
📌 Key Decision Zone: ₹430–₹475
The ₹430–₹475 zone is the BIG level to watch.
⚠️ Pattern confirmation is required before taking any trade.
⚠️ Technical analysis only. Not a buy/sell recommendation.
#SPARC #HarmonicPattern #TechnicalAnalysis #NSE #StockMarket #SwingTrading #PriceAction

면책사항
해당 정보와 게시물은 금융, 투자, 트레이딩 또는 기타 유형의 조언이나 권장 사항으로 간주되지 않으며, 트레이딩뷰에서 제공하거나 보증하는 것이 아닙니다. 자세한 내용은 이용 약관을 참조하세요.
면책사항
해당 정보와 게시물은 금융, 투자, 트레이딩 또는 기타 유형의 조언이나 권장 사항으로 간주되지 않으며, 트레이딩뷰에서 제공하거나 보증하는 것이 아닙니다. 자세한 내용은 이용 약관을 참조하세요.