
...is highly unlikely.
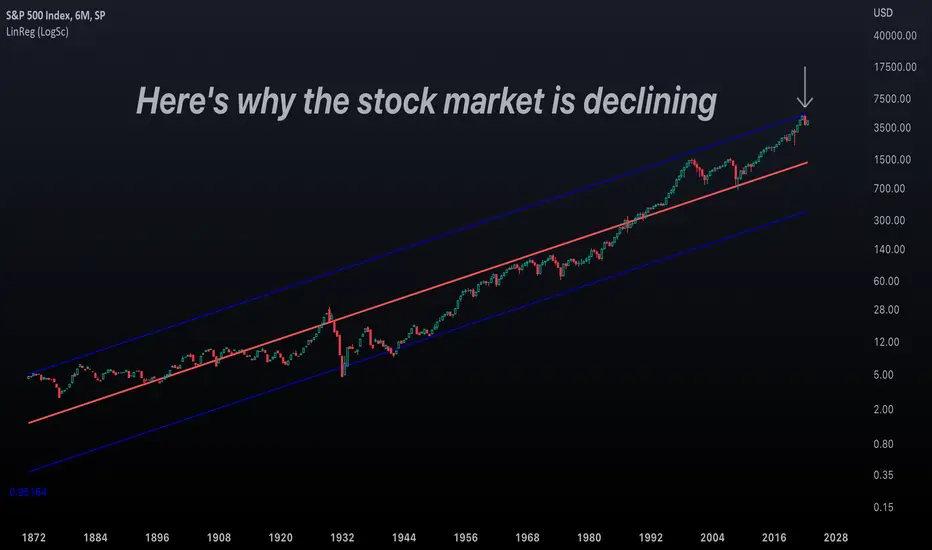
The chart above shows the entire price history of the S&P 500. Each candle is a 6-month period. The channel that you see is a regression channel. It shows how far above or below the mean the stock market is at a given time.
At the close of 2021, the stock market hit the 2-sigma deviation from the mean. This is about as over-extended as it ever has been.
The Federal Reserve has been pumping the stock market up for decades with lower and lower interest rates and quantitative easing:

Looking at this 6-month chart, if it were a daily chart, how would you trade it?

The yearly chart is no less concerning. Here's the yearly chart of the S&P 500:

I am not posting this to incite trading based on fear. Never buy or sell based on emotions. I still hold plenty of long positions myself since yearly charts are not to be traded on. These charts, however, call for extreme defensive plays. Have your stop losses in place. Trade strategically and consider how much risk you're taking for how much reward.
It's highly unlikely that we're going to have a V-shaped recovery in the stock market and that we will casually blast through new all-time highs for years.
You can read my post below about the extreme yield curve inversion that has already occurred, and my post on why I believe the charts are saying a significant recession is coming.
The chart above shows the entire price history of the S&P 500. Each candle is a 6-month period. The channel that you see is a regression channel. It shows how far above or below the mean the stock market is at a given time.
At the close of 2021, the stock market hit the 2-sigma deviation from the mean. This is about as over-extended as it ever has been.
The Federal Reserve has been pumping the stock market up for decades with lower and lower interest rates and quantitative easing:
Looking at this 6-month chart, if it were a daily chart, how would you trade it?
The yearly chart is no less concerning. Here's the yearly chart of the S&P 500:
I am not posting this to incite trading based on fear. Never buy or sell based on emotions. I still hold plenty of long positions myself since yearly charts are not to be traded on. These charts, however, call for extreme defensive plays. Have your stop losses in place. Trade strategically and consider how much risk you're taking for how much reward.
It's highly unlikely that we're going to have a V-shaped recovery in the stock market and that we will casually blast through new all-time highs for years.
You can read my post below about the extreme yield curve inversion that has already occurred, and my post on why I believe the charts are saying a significant recession is coming.
노트
It's hard to overstate the scope and duration of quantitative tightening that will be needed to squash inflation and the effect it will have on the economy. The best analogy is to imagine taking away a drug from an addict who, for decades, has been injected with more and more stimulus.

관련 발행물
면책사항
해당 정보와 게시물은 금융, 투자, 트레이딩 또는 기타 유형의 조언이나 권장 사항으로 간주되지 않으며, 트레이딩뷰에서 제공하거나 보증하는 것이 아닙니다. 자세한 내용은 이용 약관을 참조하세요.
면책사항
해당 정보와 게시물은 금융, 투자, 트레이딩 또는 기타 유형의 조언이나 권장 사항으로 간주되지 않으며, 트레이딩뷰에서 제공하거나 보증하는 것이 아닙니다. 자세한 내용은 이용 약관을 참조하세요.