
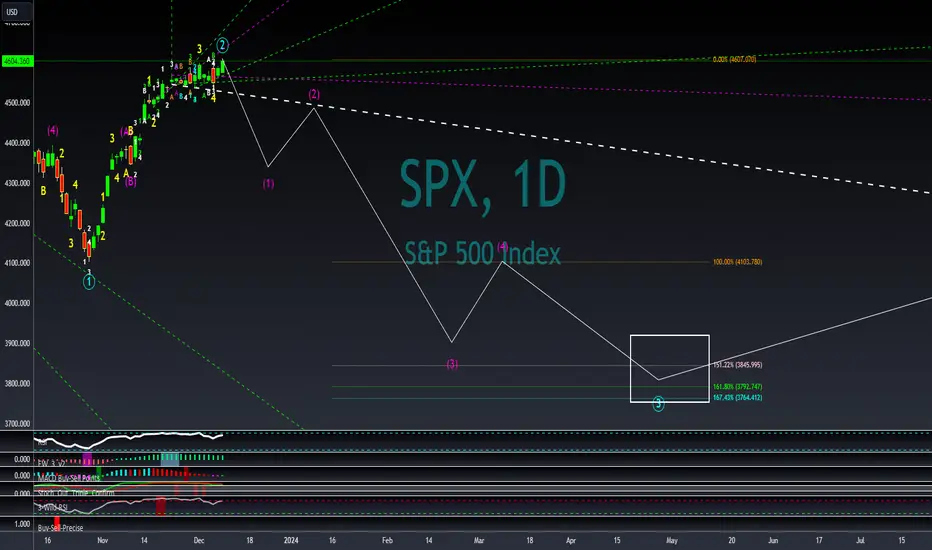
Here is out map of Primary wave 2 to this point. It is unclear if Minor 5 and Primary wave 2 are completed.

Now that Primary wave 2 retraced all of Primary wave 1's movement and then some, instead of limiting historical datasets to a ratioed range, I am comparing all similar micro waves where wave 2 moved more than wave 1. Elliott wave theory says wave 2 cannot move more than wave 1, my modified theory permits this when it occurs. Wave 1's movement / Wave 2's movement = 0.9957. I compared all data in which this ratio is less than 1 (Wave 2 was larger than wave 1) and the numbers look a little more realistic moving forward.
According to the data, Primary wave 3 should bottom above 3754 and less than 4036. The duration will likely last 608-740 trading hours. I still have other models with heavy agreement at a duration around 690-699 hours. Most models have the bottom between 3750-3799, which falls inline with the historical ratioed data. I will use the target of 3775 (drop 834.23 points from Friday's high) in 690 hours for estimating the Intermediate wave endpoints.
Preliminary bottom for Intermediate 1 is below 4350 before December 25. Intermediate wave 2 up toward 4500 by January 10. Intermediate wave 3 will be a significant drop over time, current look is 3900 by end of February. Intermediate wave 4 bounces up toward 4100 by mid-March. Current Primary wave 3 and Intermediate wave 5 bottom is around 3775 by early May.
Again this is all under the assumption Primary wave 2 is where we are, has completed, or will complete shortly after the open tomorrow. Primary wave 2 cannot realistically sustain too much more upside otherwise my wave placement is well off. More updates to follow.
Now that Primary wave 2 retraced all of Primary wave 1's movement and then some, instead of limiting historical datasets to a ratioed range, I am comparing all similar micro waves where wave 2 moved more than wave 1. Elliott wave theory says wave 2 cannot move more than wave 1, my modified theory permits this when it occurs. Wave 1's movement / Wave 2's movement = 0.9957. I compared all data in which this ratio is less than 1 (Wave 2 was larger than wave 1) and the numbers look a little more realistic moving forward.
According to the data, Primary wave 3 should bottom above 3754 and less than 4036. The duration will likely last 608-740 trading hours. I still have other models with heavy agreement at a duration around 690-699 hours. Most models have the bottom between 3750-3799, which falls inline with the historical ratioed data. I will use the target of 3775 (drop 834.23 points from Friday's high) in 690 hours for estimating the Intermediate wave endpoints.
Preliminary bottom for Intermediate 1 is below 4350 before December 25. Intermediate wave 2 up toward 4500 by January 10. Intermediate wave 3 will be a significant drop over time, current look is 3900 by end of February. Intermediate wave 4 bounces up toward 4100 by mid-March. Current Primary wave 3 and Intermediate wave 5 bottom is around 3775 by early May.
Again this is all under the assumption Primary wave 2 is where we are, has completed, or will complete shortly after the open tomorrow. Primary wave 2 cannot realistically sustain too much more upside otherwise my wave placement is well off. More updates to follow.

All forecasts are based on analysis of past behavior. Prior movements are not always indicative of future movement. Develop the theory, test the theory. Do your own research. Nothing in this analysis constitutes advice. YouTube For More. Good luck!!
관련 발행물
면책사항
해당 정보와 게시물은 금융, 투자, 트레이딩 또는 기타 유형의 조언이나 권장 사항으로 간주되지 않으며, 트레이딩뷰에서 제공하거나 보증하는 것이 아닙니다. 자세한 내용은 이용 약관을 참조하세요.
All forecasts are based on analysis of past behavior. Prior movements are not always indicative of future movement. Develop the theory, test the theory. Do your own research. Nothing in this analysis constitutes advice. YouTube For More. Good luck!!
관련 발행물
면책사항
해당 정보와 게시물은 금융, 투자, 트레이딩 또는 기타 유형의 조언이나 권장 사항으로 간주되지 않으며, 트레이딩뷰에서 제공하거나 보증하는 것이 아닙니다. 자세한 내용은 이용 약관을 참조하세요.