
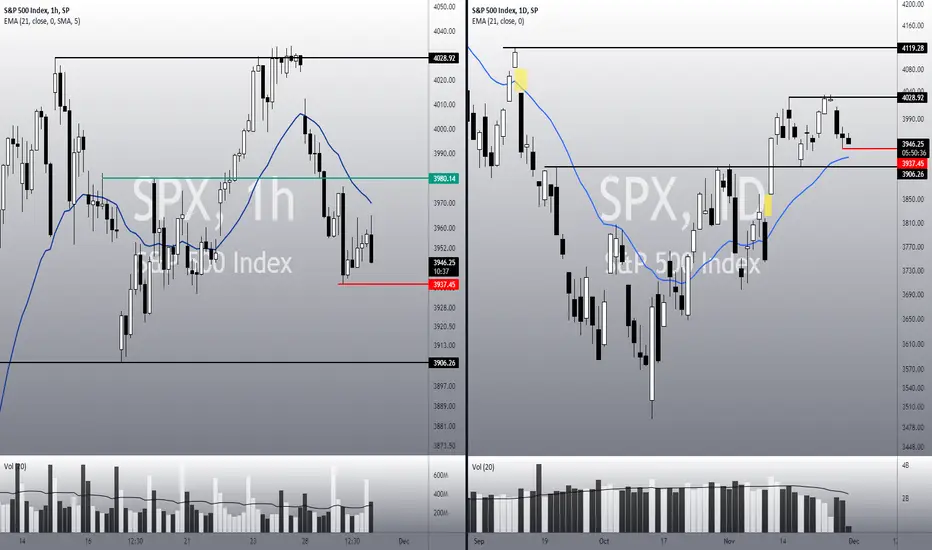
• Since it hit our first target, the index keeps falling, as there is no bullish structure to make it reverse in the short-term;
• Only if it breaks the 21 ema (1h), along with the 3,980, we might see a bullish sign;
• In the 1h chart, it is still trading below the 21 ema, doing lower highs/lows;
• In theory, it is seeking the 21 ema in the daily chart, which is quite close to other support level at 3,900 (previous bottom);
• If SPX loses 3,937, the drop might accelerate, we this is a bearish pivot point;
• Although the trend is bearish in the 1h chart, it is still bullish in the daily chart. Therefore, we must keep our eyes open, as the index is heading to a critical key point.
Remember to follow me to keep in touch with my daily analyses!
• Only if it breaks the 21 ema (1h), along with the 3,980, we might see a bullish sign;
• In the 1h chart, it is still trading below the 21 ema, doing lower highs/lows;
• In theory, it is seeking the 21 ema in the daily chart, which is quite close to other support level at 3,900 (previous bottom);
• If SPX loses 3,937, the drop might accelerate, we this is a bearish pivot point;
• Although the trend is bearish in the 1h chart, it is still bullish in the daily chart. Therefore, we must keep our eyes open, as the index is heading to a critical key point.
Remember to follow me to keep in touch with my daily analyses!

관련 발행물
면책사항
해당 정보와 게시물은 금융, 투자, 트레이딩 또는 기타 유형의 조언이나 권장 사항으로 간주되지 않으며, 트레이딩뷰에서 제공하거나 보증하는 것이 아닙니다. 자세한 내용은 이용 약관을 참조하세요.
면책사항
해당 정보와 게시물은 금융, 투자, 트레이딩 또는 기타 유형의 조언이나 권장 사항으로 간주되지 않으며, 트레이딩뷰에서 제공하거나 보증하는 것이 아닙니다. 자세한 내용은 이용 약관을 참조하세요.