
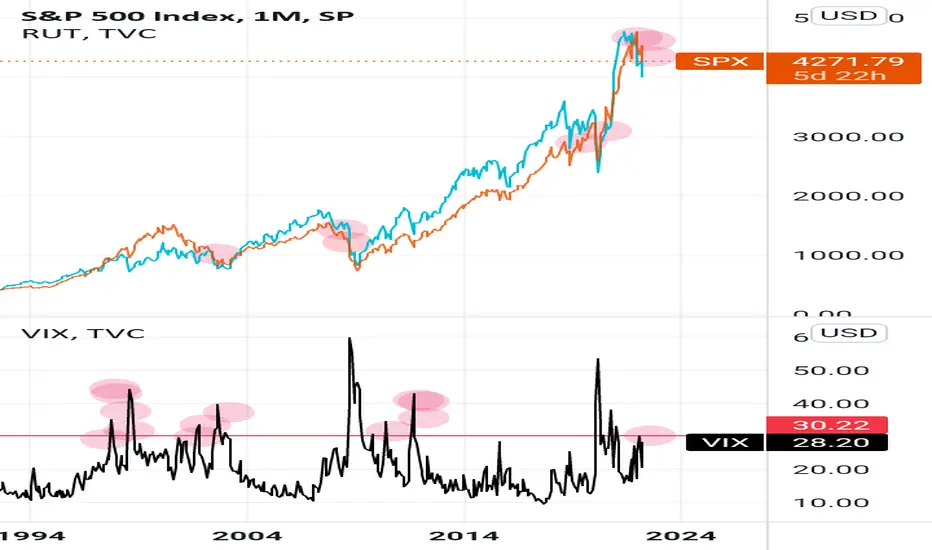
Chart 1: Whenever the the Russell 2000 came down and got close (from above) to the SPX, the SPX went further down.
(Pleased ignore the first red dot to the left, as the Russell die not come down there to meet the SPX but vice versa)
Chart 2: Whenever the VIX, coming from a modest down, crossed the red line, soon further spikes in volatility followed (red dots).
Particularly if the the VIX should cross the red line soon, you might consider hedging your positions.
노트
Please also note the VIX pattern since last May, which cannot be found at any other spot in the VIX!
관련 발행물
면책사항
해당 정보와 게시물은 금융, 투자, 트레이딩 또는 기타 유형의 조언이나 권장 사항으로 간주되지 않으며, 트레이딩뷰에서 제공하거나 보증하는 것이 아닙니다. 자세한 내용은 이용 약관을 참조하세요.
면책사항
해당 정보와 게시물은 금융, 투자, 트레이딩 또는 기타 유형의 조언이나 권장 사항으로 간주되지 않으며, 트레이딩뷰에서 제공하거나 보증하는 것이 아닙니다. 자세한 내용은 이용 약관을 참조하세요.